Nodal Analysis - Forecast
1. Overview
This module within the Nodal Analysis section is designed to forecast long-term well performance under different wellbore configurations and operating conditions, while accounting for reservoir pressure depletion.
Traditionally, evaluating how a well will perform as the reservoir depletes required building a numerical reservoir model, or manually generating IPR curves at several future reservoir pressures and comparing their intersections with each VLP. This feature simplifies the workflow by combining the current IPR, a material balance pressure forecast, and wellbore configuration changes into one tool.
Within this tool, you can:
- Forecast production rate and flowing bottomhole pressure (BHP) as the reservoir depletes.
- Compare different flowpaths, tubing sizes, and artificial lift methods.
- Assess the production impact of changes in wellhead pressure and choke settings.
- Inspect the future IPR and VLP curves at any date in the forecast.
- Identify when an intervention may be required to sustain production.
The goal is to give a quick, physically grounded view of future well performance, so that interventions such as a tubing change, artificial lift installation, or compression can be planned before they become urgent.
1.1. Current and Future Well Performance
An inflow performance relationship (IPR) describes how much the reservoir can deliver at a given reservoir pressure. A vertical lift performance (VLP) curve describes the bottomhole pressure the wellbore requires to lift a given rate under a specific configuration. Where the two curves intersect is the operating point (i.e., the production rate and flowing BHP at which the well produces).
The FORECAST tab extends this analysis into the future. A configuration that performs well today may perform quite differently at a lower reservoir pressure, so the forecast lets you see how each case holds up over time, and inspect the corresponding future IPR and VLP curves.
For more details on the underlying inflow and wellbore relationships, see IPR/VLP.
1.2. Prerequisites and Layout
To begin, you need a current IPR curve, and a reservoir pressure forecast from either the Multiphase Flowing Material Balance or the Numerical Model.
The FORECAST tab contains a Productivity Index Data panel and a Material Balance / Tank Data panel. It is worth reviewing both when setting up the analysis, as the starting inflow and depletion assumptions should be consistent with the well's observed behavior.
The annotated image below highlights the five main areas of the tab. Areas 2 and 3 set the basis for the forecast, area 4 displays the resulting IPR and VLP curves, and area 5 is where you define the forecast cases.
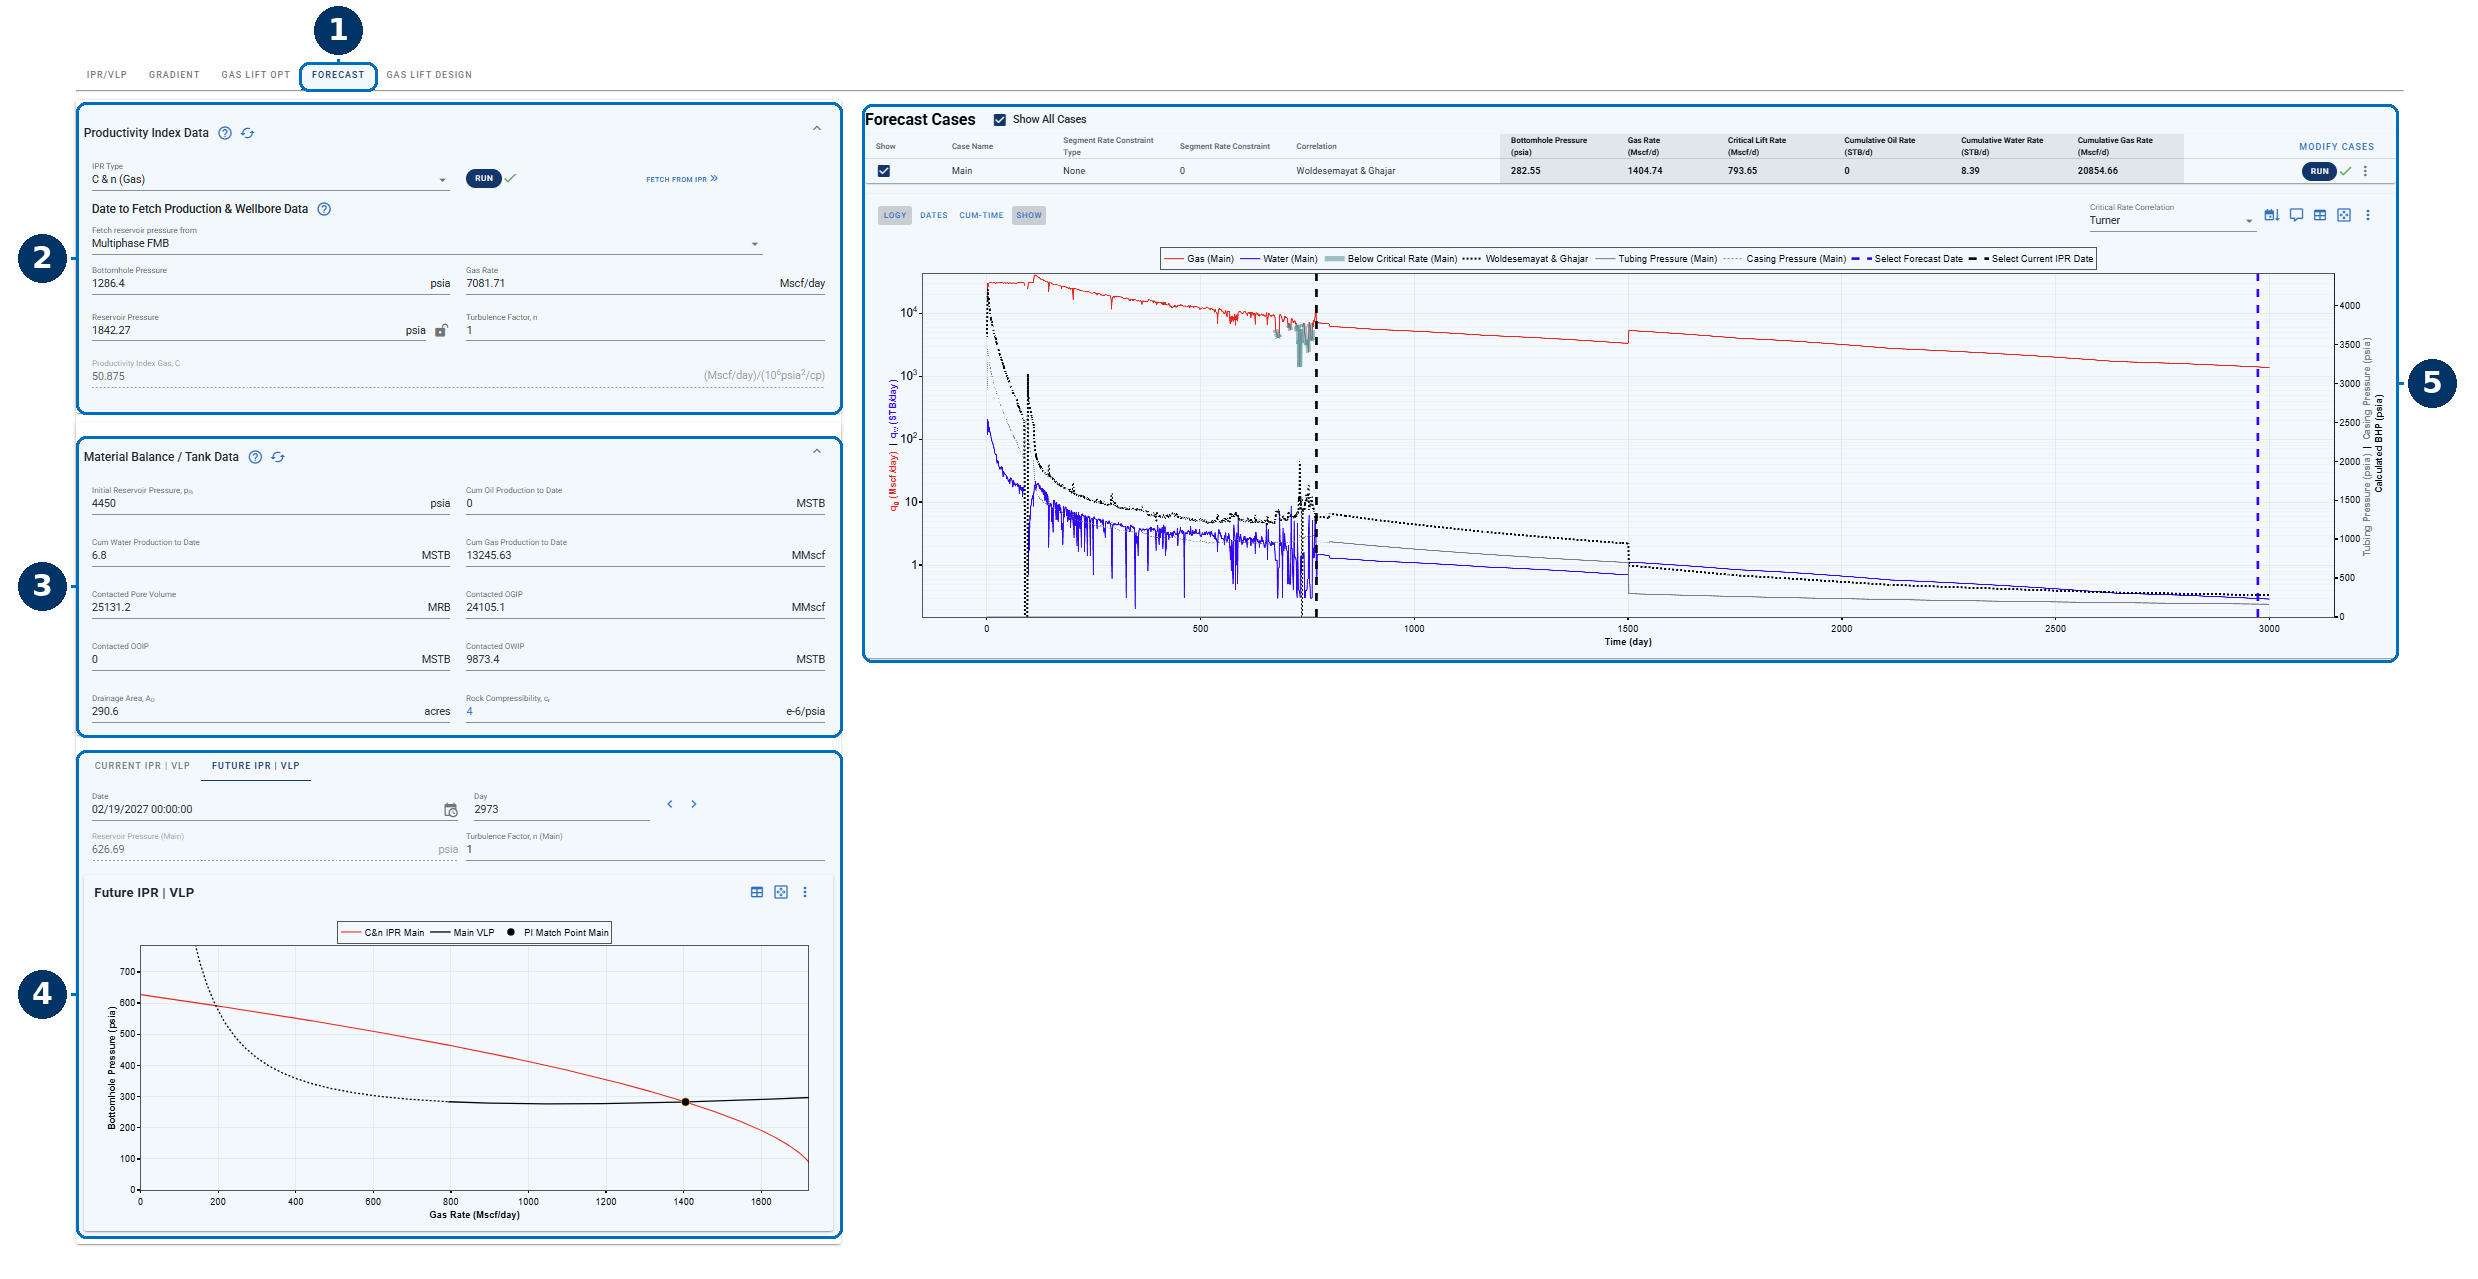
- FORECAST tab.
- Productivity Index Data: Specify the latest IPR curve. You can import the IPR curve from the IPR/VLP tab by clicking FETCH FROM IPR. Here you also select whether to use the reservoir pressure forecast from the Multiphase FMB or the Numerical Model.
- Material Balance / Tank Data: Specify the material balance outputs. You can fetch these from the Flowing Material Balance module by clicking the refresh icon (
 ).
). - IPR | VLP plots, comprising two tabs:
- CURRENT IPR | VLP: displays the current IPR, as specified in area 2.
- FUTURE IPR | VLP: displays the IPR at the selected future date.
- Forecast Cases: This is where you define the future wellbore configurations and forecast parameters.
For supporting workflows, see Bottomhole Pressure and Flowing Material Balance.
1.3. How the Nodal Forecast Works
The Nodal Forecast links the current inflow calibration to future reservoir pressure and wellbore conditions:
- Start from the current IPR. The productivity index of the current IPR, calibrated from a representative production period, is held fixed for the rest of the forecast.
- Forecast reservoir pressure. The Multiphase Flowing Material Balance (or the Numerical Model) provides the average reservoir pressure at each future date.
- Specify the wellbore forecast. You define the expected WGR, OGR, and WHP over time, which set the VLP at each date.
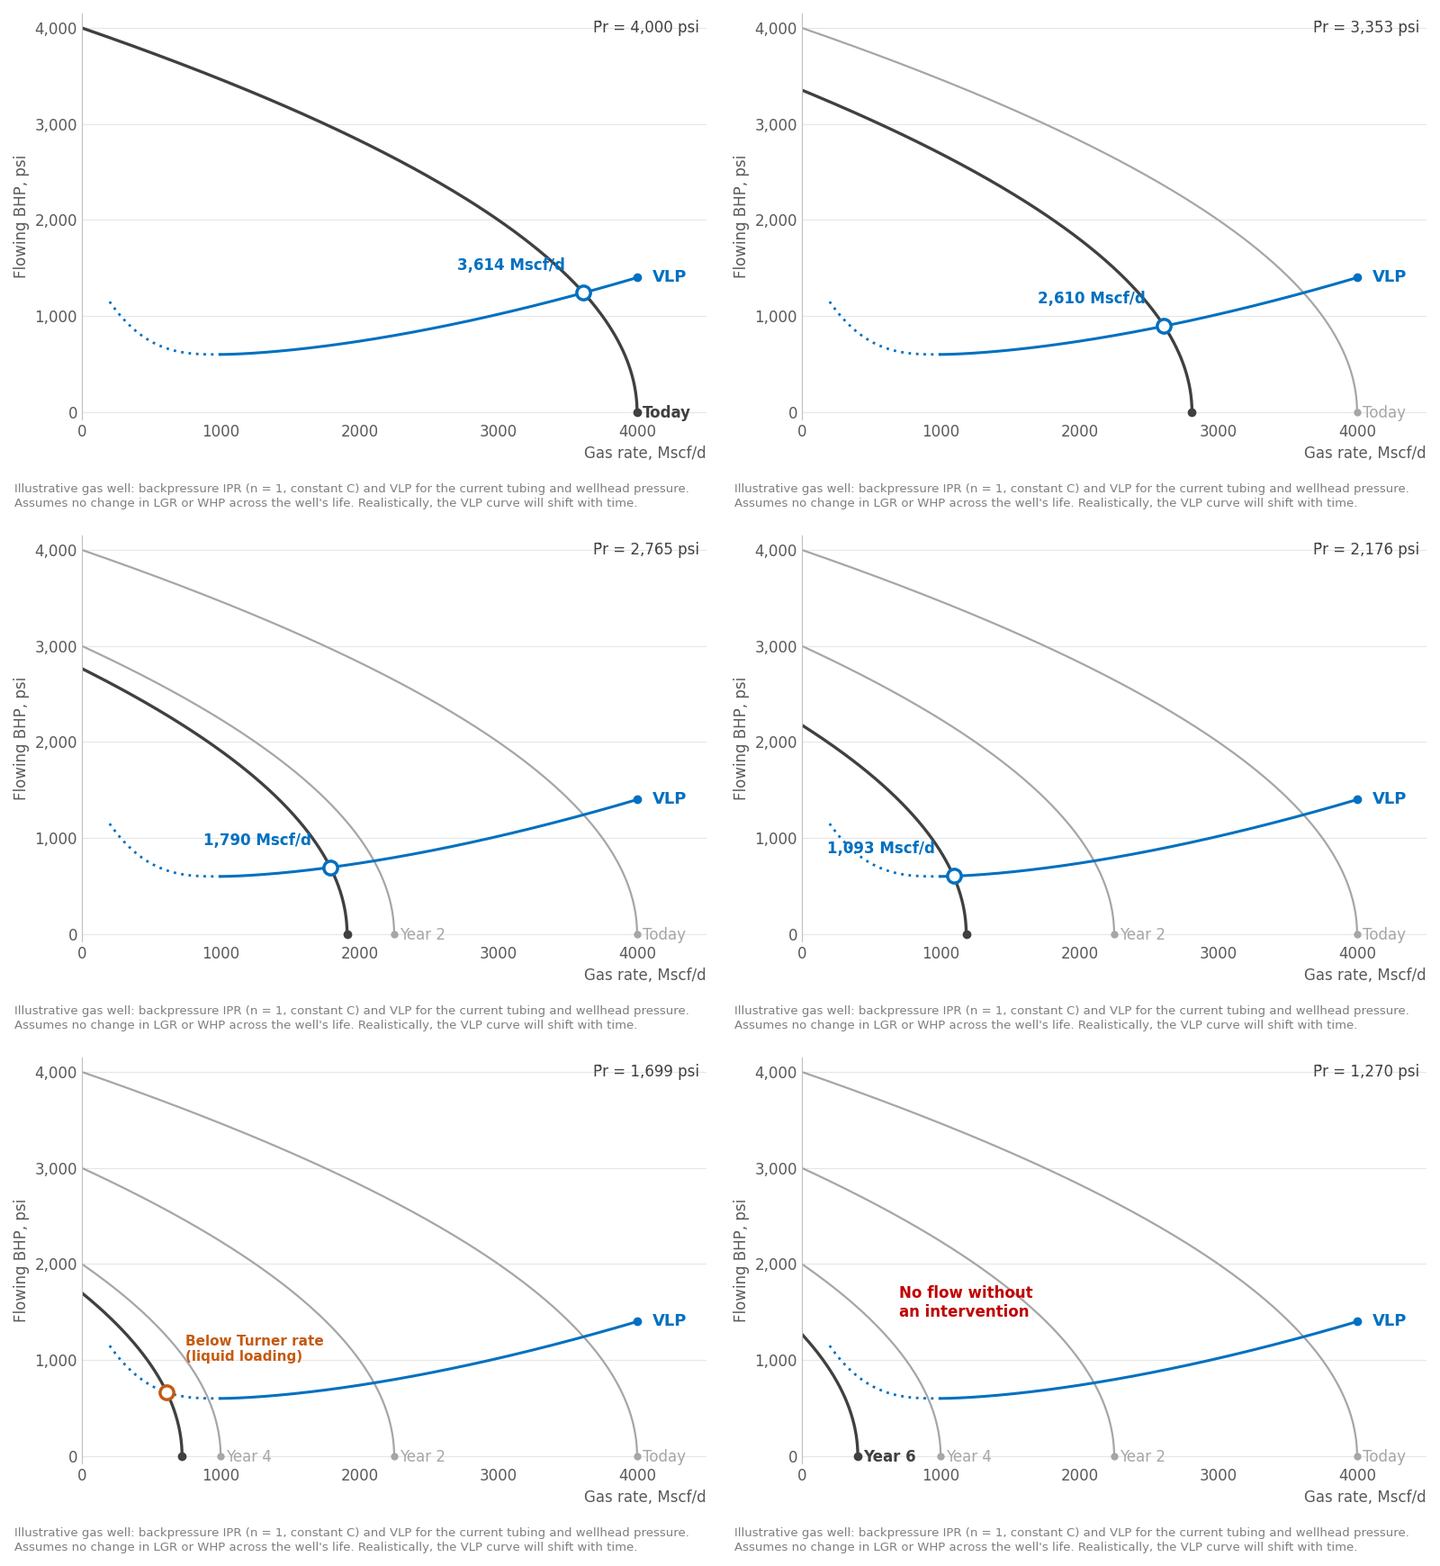
- Build a new IPR at each date. A new IPR curve is constructed for every future date using the fixed productivity index and the forecast reservoir pressure. As reservoir pressure declines, the IPR curve shifts downward.
- Intersect the IPR with the VLP. The intersection of the VLP with the IPR for that date gives the production rate and flowing BHP.
Repeating this process produces rate and flowing BHP profiles over time. By reviewing the future intersections, you can also identify when the existing configuration may need an intervention to sustain production. The GIF below shows how the IPR shifts as the reservoir depletes:
2. Inputs
2.1. Productivity Index Data
The Productivity Index Data panel sets the starting inflow performance used in the forecast. It combines production rates and pressure data from a representative operating period with the selected IPR Type.
To populate it, select a Date to Fetch Production & Wellbore Data and a reservoir pressure source, such as Multiphase FMB. If the required data is available for the selected date, the following values are populated automatically:
| Input | Source and purpose |
|---|---|
| Liquid Rate / Gas Rate | Production Data provides the rate used to establish inflow performance. The displayed rate input depends on the selected IPR type. |
| Gas/Oil Ratio | Calculated from the Production Data input, where applicable. |
| Bottomhole Pressure | Fetched from the Bottomhole Pressure feature and used as the flowing pressure for the selected operating point. |
| Reservoir Pressure | Obtained from the selected reservoir pressure source and used with bottomhole pressure to establish the pressure drawdown. |
| Saturation Pressure | Fetched from the PVT feature, where applicable to the selected IPR type. |
Alternatively, you can retrieve an existing IPR by clicking FETCH FROM IPR, or manually input values into each field. Either way, the rates and pressures should represent the same operating conditions. Once the inputs are in place, check CURRENT IPR | VLP to confirm that the starting inflow response is representative of the well.
Once you have reviewed the inputs, click RUN to calculate the productivity parameters for the selected IPR type.
2.2. Material Balance / Tank Data
The Material Balance / Tank Data panel describes the reservoir volume contacted by the well and the production already withdrawn from that volume. These inputs set the starting depletion state for the forecast, and should be consistent with the reservoir pressure used in Productivity Index Data.
If you are using the Flowing Material Balance, you select a representative slope on the Flowing Material Balance plot, and the contacted pore volume is the inverse of this slope. The selected interpretation should represent the production interval used to set the forecast's starting conditions.
| Input | Description |
|---|---|
| Initial Reservoir Pressure | Reservoir pressure before depletion, distinct from the current reservoir pressure used to establish inflow performance. |
| Cum Oil Production to Date | Oil produced up to the date used to initialize the forecast. |
| Cum Water Production to Date | Water produced up to the date used to initialize the forecast. |
| Cum Gas Production to Date | Gas produced up to the date used to initialize the forecast. |
| Contacted Pore Volume | Reservoir pore volume represented by the material balance interpretation. |
| Contacted OGIP | Original gas in place within the contacted reservoir volume. |
| Contacted OOIP | Original oil in place within the contacted reservoir volume. |
| Contacted OWIP | Original water in place within the contacted reservoir volume. |
| Drainage Area | Area associated with the contacted reservoir volume. |
| Rock Compressibility | Describes how the reservoir pore volume changes with pressure. |
OOIP, OGIP, and OWIP denote original oil, gas, and water in place, respectively. Original in-place volumes describe the initial inventory, rather than the remaining inventory at the forecast start.
3. Forecast Workflow
3.1. Open Forecast and Review the Starting Conditions
- Open the well and navigate to Nodal Analysis → FORECAST.
- Review the Productivity Index Data and Material Balance / Tank Data panels.
- Check CURRENT IPR | VLP to confirm that the starting inflow and wellbore response are representative of the operating conditions you are modeling.
If the starting case does not match observed performance, it is worth resolving the difference before using the forecast to evaluate an intervention.
3.2. Add a Case and Define the Forecast Schedule
The Forecast Schedule window is where you define how wellhead pressure, production ratios, and wellbore configuration change over the course of a case.
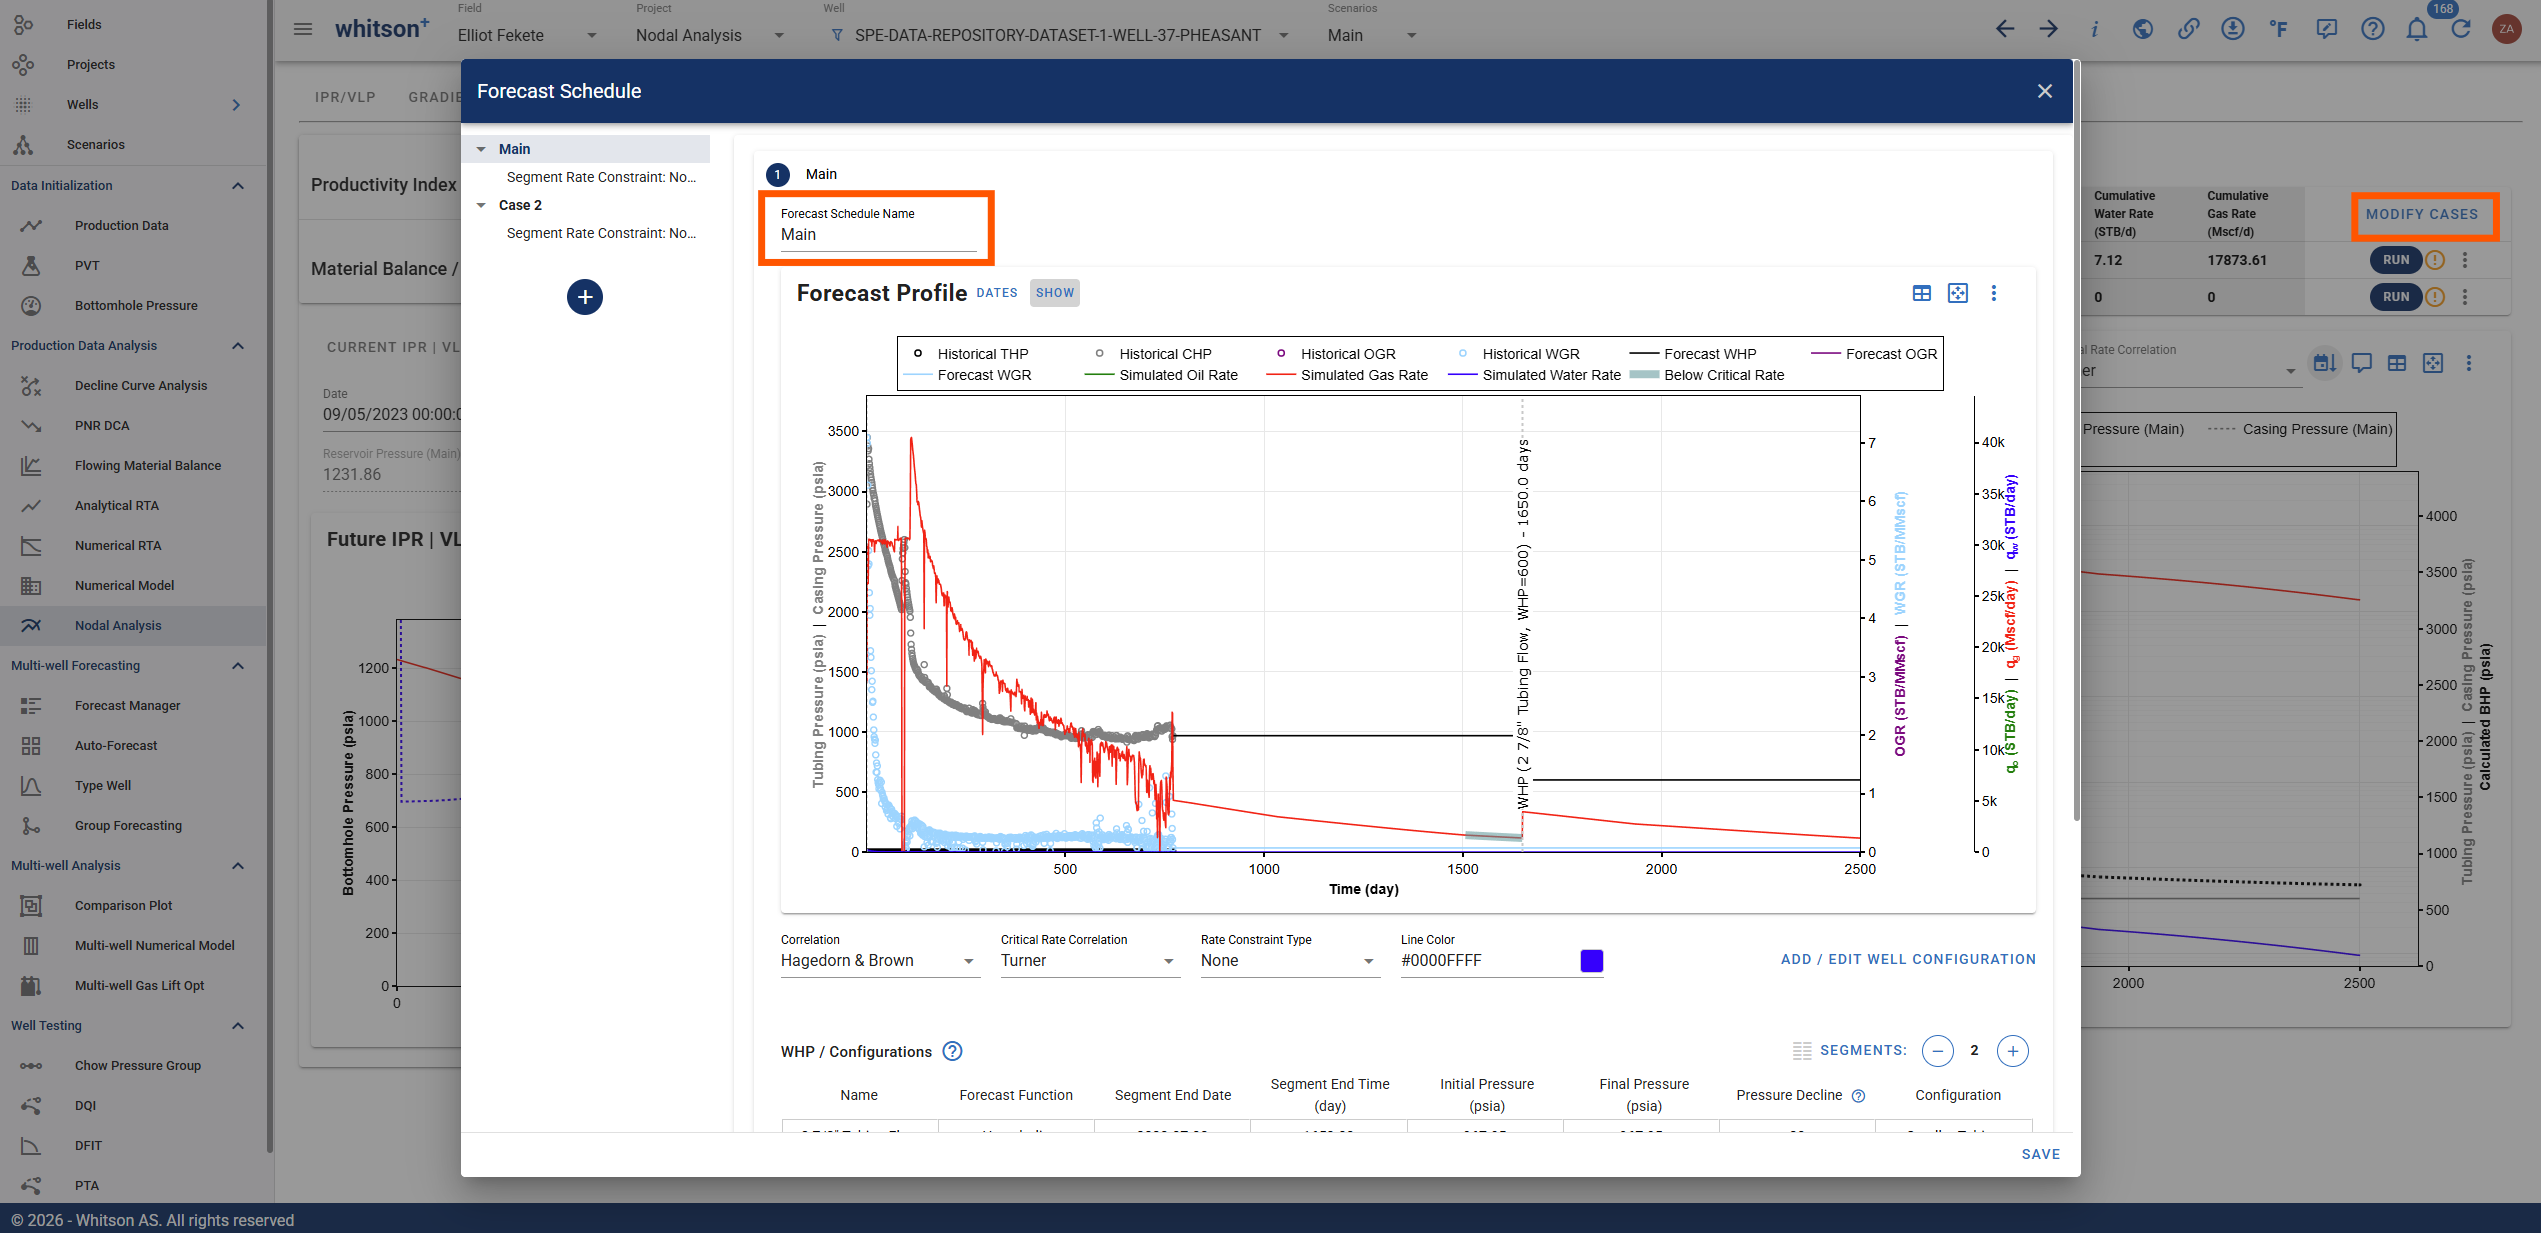
- Click MODIFY CASES in the Forecast Cases table to set up the cases you want to compare.
- Add a case in the left panel and give it a descriptive Forecast Schedule Name.
- Review the Correlation, Critical Rate Correlation, Rate Constraint Type, and Line Color.
-
In WHP / Configuration, specify the pressure schedule and select the wellbore configuration for each segment.
You can set the pressure schedule by specifying either a Final Pressure or a Pressure Decline. If you enter a pressure decline, the final pressure is calculated from the initial pressure, and vice versa.
Pressure Decline Units
If the Forecast Function is set to hyperbolic, the pressure decline is in % per year. If it is set to linear, the decline is in psi/day (or bar/day or kPa/day, depending on your unit preferences).
-
Review the production-ratio (WGR and OGR) schedules.
- Use the + and - controls beside SEGMENTS to add or remove segments. For each segment, review the Forecast Function, Segment End Date, Segment End Time, initial and final values, and decline input.
- Check the Forecast Profile plot to confirm the timing and magnitude of the changes, then click SAVE.
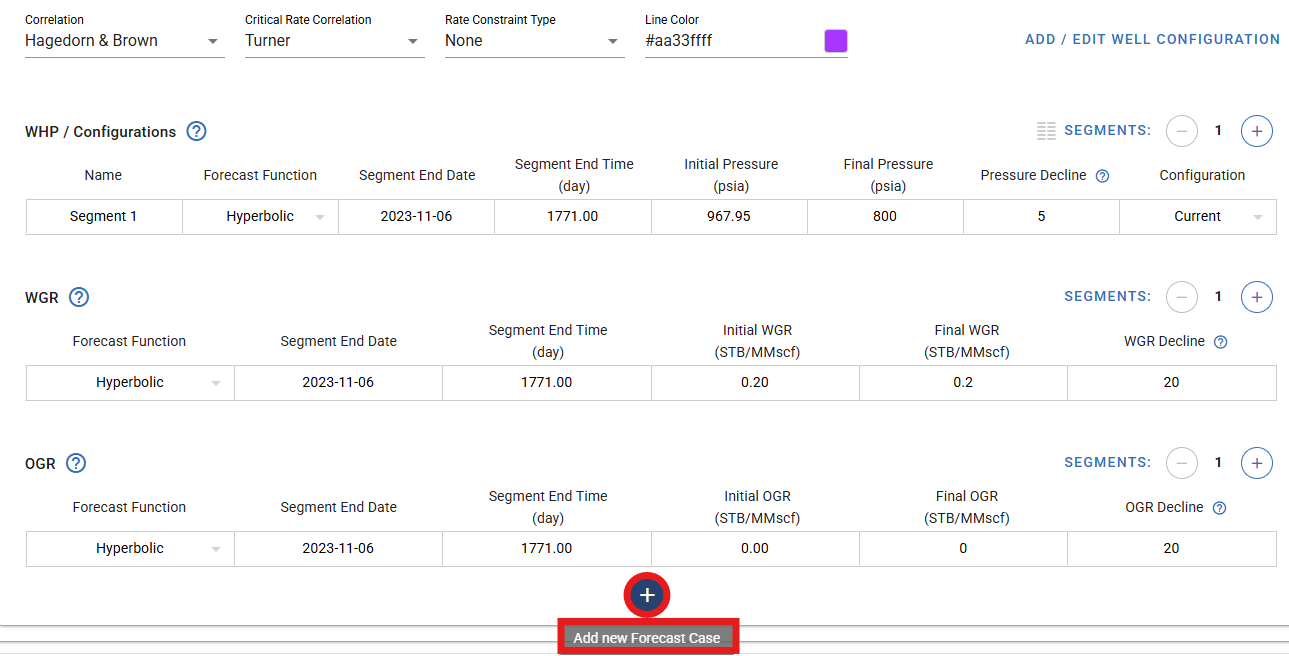
Each segment represents a period with a defined trend. For example, a forecast can keep the Current wellbore configuration for an initial period, then switch to smaller tubing in a later WHP / Configuration segment. Segment dates should reflect when you plan to carry out the intervention.
3.3. Add or Edit Wellbore Configurations
The ADD / EDIT WELL CONFIGURATION option in the Forecast Schedule window lets you set up configurations for the planned operating changes.
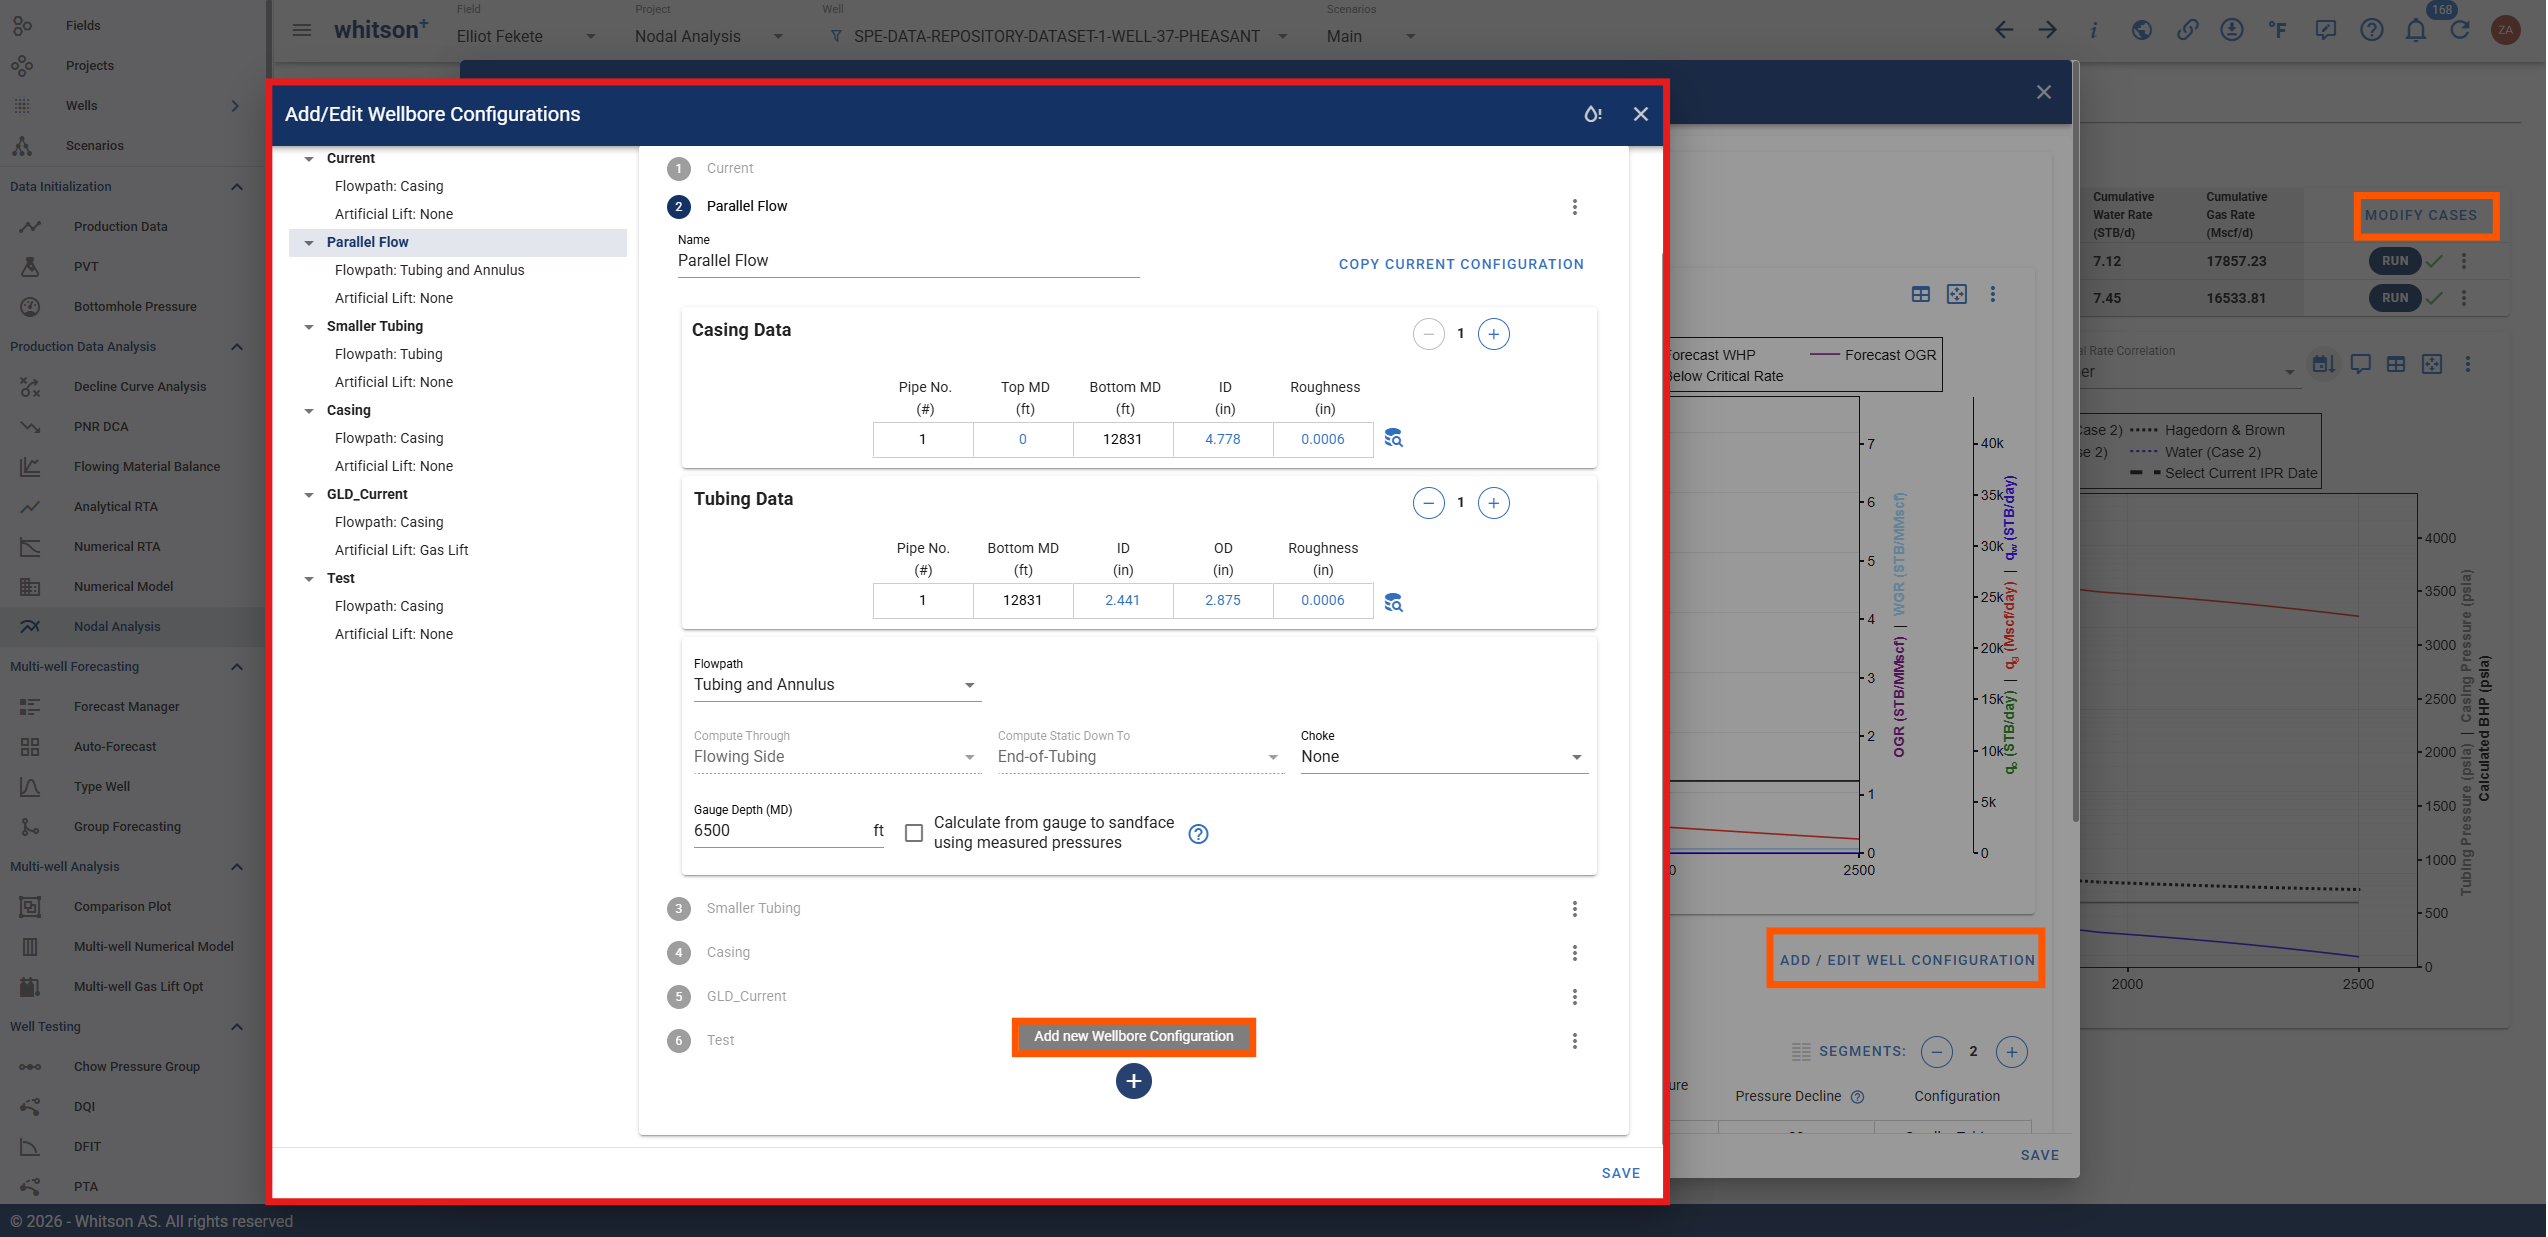
- Click ADD / EDIT WELL CONFIGURATION.
- Select an existing configuration or click + to add a configuration.
- Enter a descriptive name. You can click COPY CURRENT CONFIGURATION to use the current wellbore setup as a starting point.
- Review the Casing Data and Tubing Data, including depths, diameters, and roughness.
- Select the Flowpath and Artificial Lift Method. Review any other applicable inputs, such as Compute Through, Gauge Depth, and Choke, and complete the inputs required by the selected lift method.
- Click SAVE to return to the Forecast Schedule, then assign the configuration to the appropriate WHP / Configuration segment.
Each configuration should represent the equipment and operating conditions you want to evaluate. For more information on each method, see Artificial Lift Methods.
3.4. Save Different Forecast Cases
A wellbore configuration describes the equipment and flowpath, while a forecast case combines configurations with pressure and production-ratio schedules. This lets you compare complete operating plans side by side.
- Click MODIFY CASES and use the + button in the left case panel to add a case.
- Enter a descriptive Forecast Schedule Name, such as Tubing Installation or Lower WHP.
- Define the schedules and assign the appropriate wellbore configurations, as described in sections 3.2 and 3.3 above.
- Repeat for each alternative case.
- Click SAVE. The saved cases will appear in the Forecast Cases table.
After saving any changes, run the affected cases to update the forecast. You can use the Show checkboxes and Show All Cases to control which results appear on the plot.

3.5. Inspect Future IPR and VLP Curves
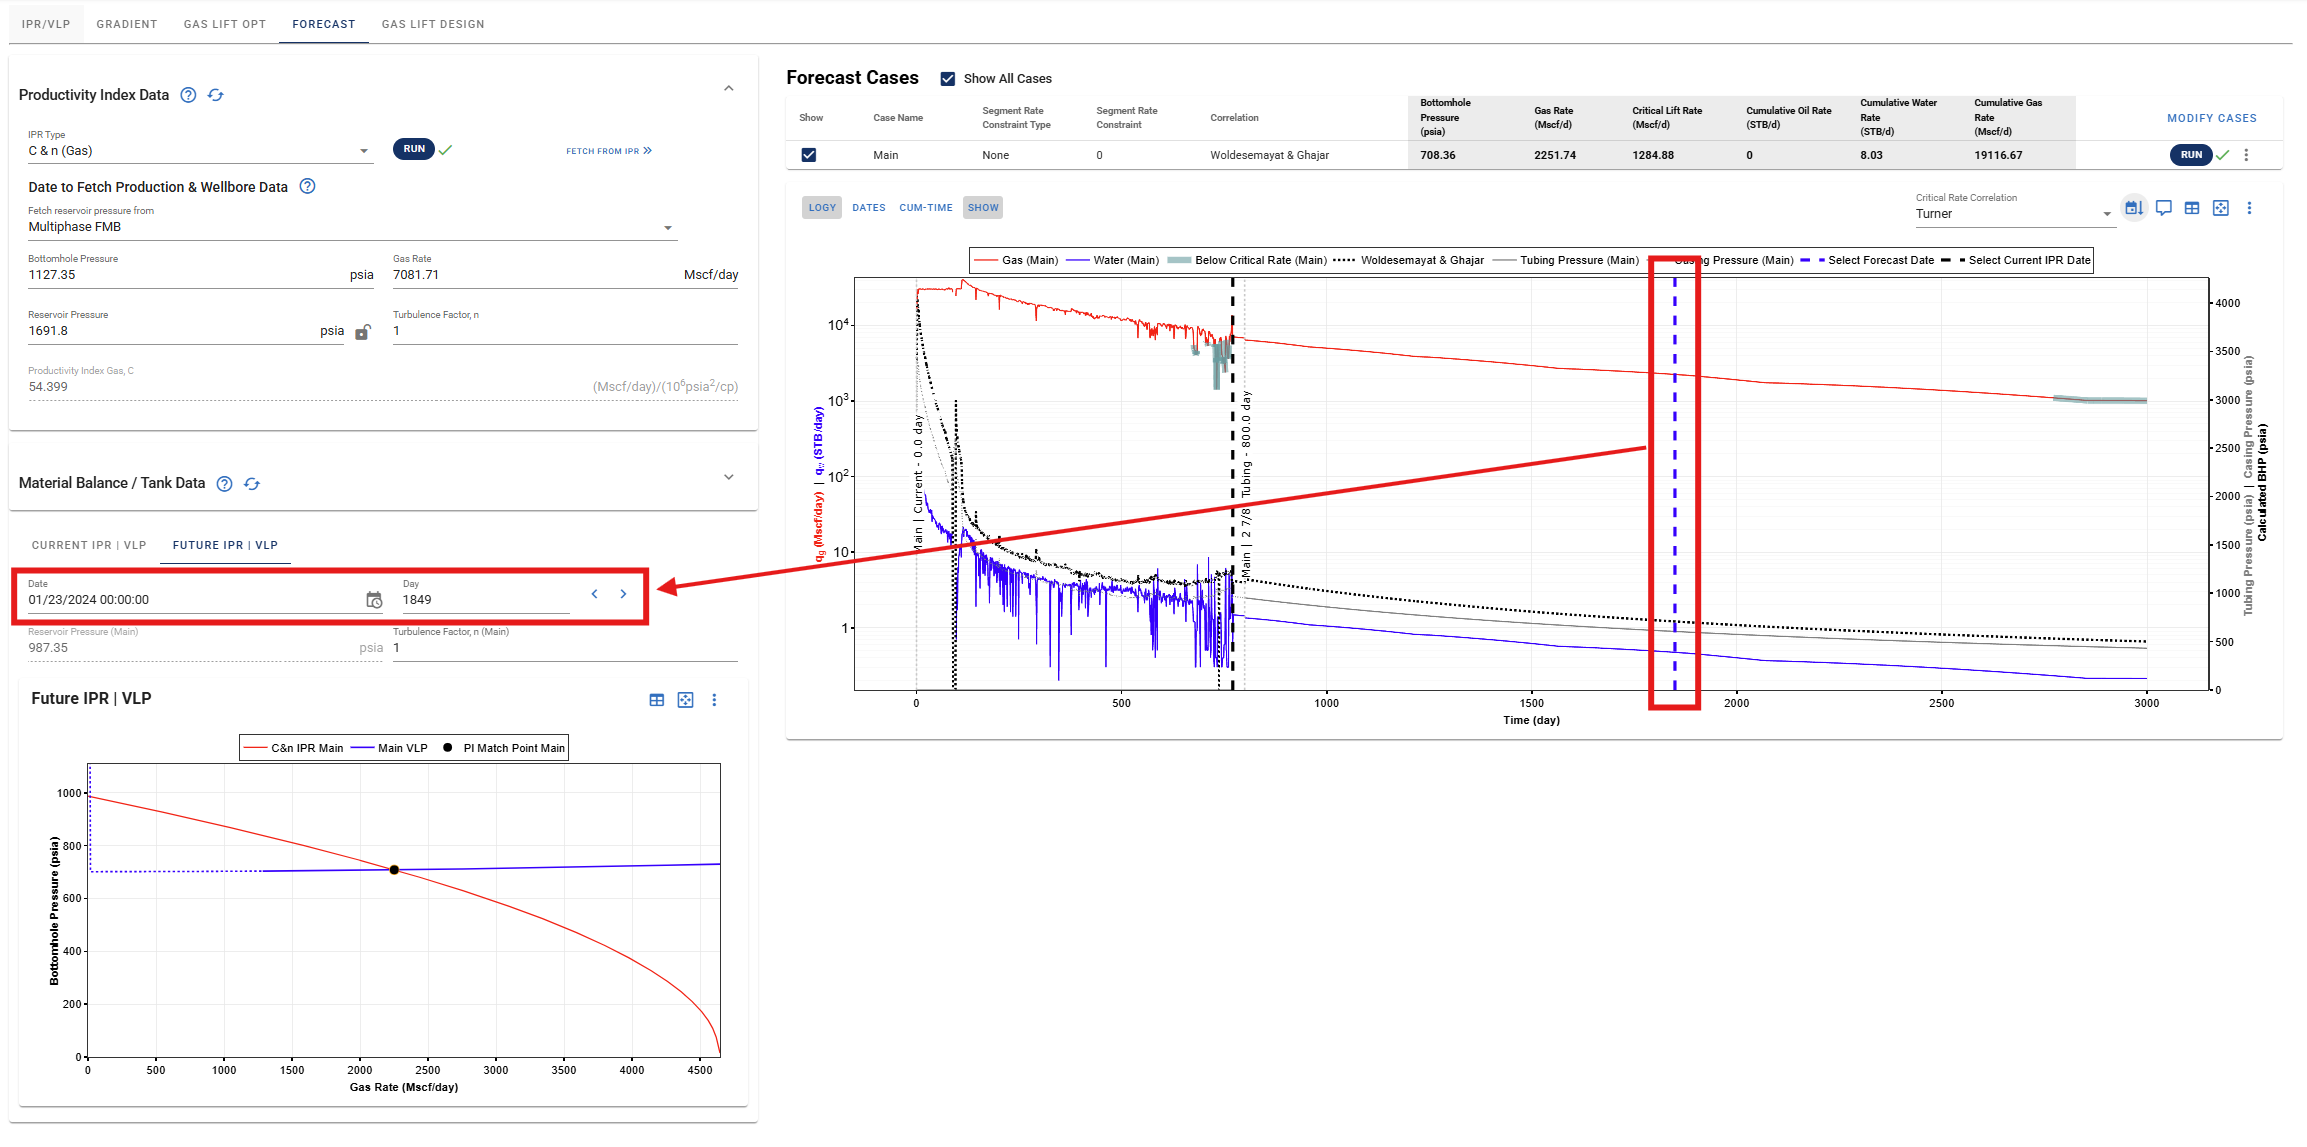
To view the forecast at a future time, select FUTURE IPR | VLP and use the Date or Day selector. You can set the forecast date either by dragging the blue line shown in the image below, or by entering the date manually.
3.6. Identify the Intervention Window
By stepping through successive dates in FUTURE IPR | VLP, you can identify when the forecast operating point approaches liquid-loading conditions, or no longer intersects on the stable side of the VLP. It is also worth comparing the operating gas rate with the applicable critical rate, such as the Turner rate, to check whether the well can continue to unload liquids.
From here, you can compare options such as a tubing change, artificial lift, or compression, and evaluate both the resulting production profile and how long each option sustains production.