Static Material Balance
1. Overview
1.1. Purpose and scope
Static material balance (MB) estimates the original hydrocarbons in place and identifies the energy sources driving a reservoir, using cumulative production and injection, fluid (PVT) properties, and static (shut-in, stabilized) average reservoir pressures. It is called “static” to distinguish it from flowing material balance, which uses flowing pressures and rates instead of shut-in pressure surveys.
This module covers:
- the general material balance equation (MBE) and the meaning of each term;
- dry-gas material balance, including the corrected () formulation for overpressured, water-drive and connected reservoirs;
- oil material balance using linearized (Havlena–Odeh) plots, pressure matching, drive indices and diagnostic plots;
- the generalized formulation for volatile oils.
1.2. The tank model
Material balance treats the reservoir as a single tank. The underlying assumptions are:
- Zero-dimensional reservoir. At any time, one average pressure (referred to a common datum) describes the whole connected pore volume, and fluid properties are uniform.
- Isothermal depletion. Reservoir temperature is constant.
- Phase equilibrium. Oil and gas in the reservoir are in equilibrium at the average pressure; PVT properties from laboratory tests represent reservoir behaviour.
- Cumulative, not incremental, balance. The equation always compares the current state at pressure with the initial state at . It is not evaluated step by step, except for time-dependent influx terms.
- Time-independence of the tank terms. Only aquifer and connected-tank influx depend explicitly on time; all other terms depend on pressure alone.
Because there is no geometry and no flow equation, the tank model cannot predict how fluids move within the reservoir — only how much expansion must have occurred to explain the observed withdrawal.
1.3. Data requirements
The reliability of a material balance analysis is governed almost entirely by the input data:
| Data | Requirement |
|---|---|
| Production and injection | Cumulative oil, gas and water produced, and gas and water injected, for every well completed in the reservoir. Missing wells or misallocated volumes bias the result. |
| Static pressure | An initial pressure and several stabilized shut-in pressures over the producing life, corrected to a common datum. Pressures from low-permeability wells that were not shut in long enough will read low. |
| PVT | Validated \(B_{o}\), \(R_{s}\), \(B_{g}\) (or \(Z\)), \(B_{w}\) and, for volatile systems, \(R_{v}\), ideally from representative bottomhole or recombined samples. |
| Rock and water | Pore-volume compressibility \(c_{f}\), water compressibility \(c_{w}\) and initial water saturation \(S_{wi}\). |
| Geology (optional) | Volumetric estimates of \(N\), \(G\) or gas-cap size \(m\) to constrain non-unique solutions. |
1.4. Average reservoir pressure
Every pressure-dependent quantity in the MBE must be evaluated at the volume-averaged reservoir pressure. Individual well pressures are first referred to a common datum,
where is the density of the continuous fluid between the gauge and the datum (lbm/ft³), and depths are true vertical depths (ft). The reservoir average is then weighted by the pore volume drained by each well:
The second relation follows from the definition of compressibility applied to each drainage volume under pseudo-steady state: a well that withdraws at rate while its pressure falls at drains a pore volume proportional to their ratio. When drainage volumes are unknown, a simple arithmetic average of datum-corrected pressures is a common fallback.
2. The General Material Balance Equation
2.1. Volume balance concept
Consider the reservoir at initial pressure and again after the average pressure has dropped to (Figure 1). If the fluids that remained in the reservoir were allowed to expand freely, they would occupy a volume larger than the original pore space. That excess must equal the volume — at reservoir conditions and pressure — of everything that left the reservoir, less what entered it:
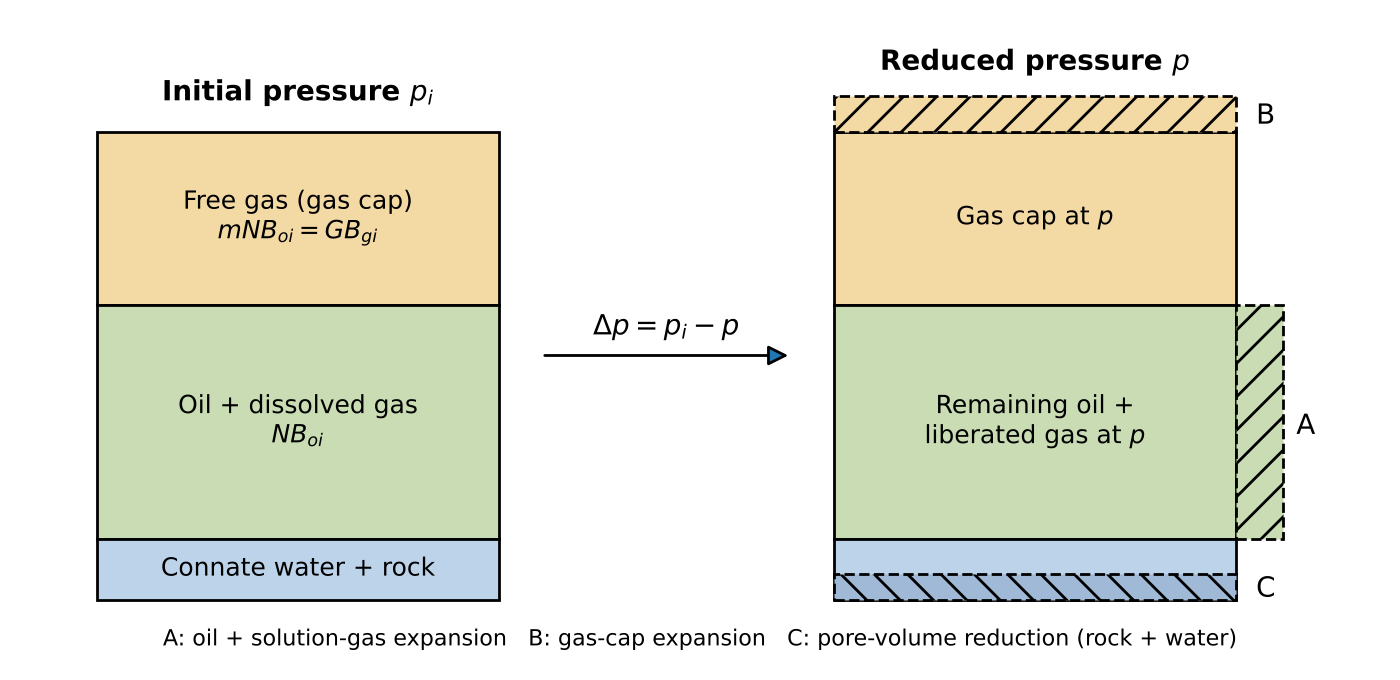 Figure 1. Volume changes in the tank when pressure drops from to . Expansion volumes A, B and C must accommodate the withdrawn fluids.
2.2. Definitions
| Symbol | Definition | Units |
|---|---|---|
| \(N\) | Original oil in place | STB |
| \(G\) | Original free gas in place (gas cap, or the whole reservoir for a gas reservoir) | scf |
| \(m\) | Ratio of initial gas-cap volume to initial oil-zone volume, \(m = GB_{gi}/\left(NB_{oi}\right)\) | – |
| \(N_{p}\), \(G_{p}\), \(W_{p}\) | Cumulative oil, gas and water produced | STB, scf, STB |
| \(R_{p}\) | Cumulative produced gas–oil ratio, \(G_{p}/N_{p}\) | scf/STB |
| \(W_{inj}\), \(G_{inj}\) | Cumulative water and gas injected | STB, scf |
| \(W_{e}\) | Cumulative water influx from the aquifer | STB |
| \(\Delta p\) | Pressure drop, \(p_{i} - p\) | psi |
2.3. Derivation
Each expansion term is the difference between the reservoir volume a fixed quantity of material occupies at and at .
(a) Oil and its originally dissolved gas. stock-tank barrels occupy at and at . Below the bubble point, the gas released from solution, scf, occupies at . The total expansion is
(b) Gas-cap gas. The free gas occupies at and at :
(c) Connate water expansion and pore-volume reduction. As pressure falls, connate water expands and the pore space contracts; both reduce the space available to hydrocarbons. With the definitions
integration from to gives the water and pore volumes at :
The reduction in hydrocarbon pore volume (HCPV ) relative to its initial value is therefore
This is the rigorous form. For constant, small compressibilities, and reduces to the familiar approximation
Since the initial HCPV is , the volume contributed by this mechanism is
(d) Underground withdrawal. The produced oil, , occupies at and carries scf of gas in solution. The remaining produced gas, , was free gas in the reservoir and occupies . Adding produced water and subtracting injected fluids:
(e) Water influx. Aquifer water entering the tank displaces an equal reservoir volume, .
Equating withdrawal to the sum of (a), (b), (c) and (e):
2.4. Compact form
Following Havlena and Odeh, define the expansion terms per stock-tank barrel of oil:
Equation (11) then becomes
where is the total expansion per STB. An equivalent form, written in terms of the free gas in place rather than (using ), separates the oil-zone and gas-cap contributions:
Equation (16) is the starting point for most of the oil analyses in Section 4.
2.5. Summary of terms
| Term | Physical Meaning |
|---|---|
| \(F\) | Net reservoir volume removed: production at reservoir conditions minus injection. |
| \(NE_{o}\) | Swelling of the remaining oil plus the volume of gas liberated from it. Above the bubble point only liquid expansion contributes. |
| \(NmE_{g}\) | Expansion of the initial gas cap into space once occupied by oil. |
| \(NE_{fw}\) | Space released by connate-water expansion and pore compaction. Small in normally pressured reservoirs, significant in undersaturated or overpressured ones. |
| \(W_{e}B_{w}\) | Water encroaching from a connected aquifer. |
Terms that do not apply to a given reservoir drop out: with no gas cap, (and ); with no aquifer, .
2.6. Undersaturated oil
Above the bubble point and no free gas exists. Writing the oil expansion through its isothermal compressibility, , Eq. (15) becomes
where and is the effective compressibility of the oil zone. Rock and water compressibility are of the same order as oil compressibility here, so must not be neglected.
3. Gas Material Balance
3.1. Volumetric dry gas
For a dry-gas reservoir with no aquifer and negligible rock and water expansion, all terms except gas expansion vanish. Equation (16) with reduces to
i.e. the gas remaining in the reservoir occupies the original gas pore volume. The gas formation volume factor follows from the real-gas law applied at reservoir and standard conditions ():
with in °R and in psia. Substituting Eq. (19) into Eq. (18) and cancelling the constant temperature:
A plot of against is a straight line with intercept at and intercept at . The slope, , gives an independent estimate of that can be checked against the extrapolation.
3.2. Reading the p/Z plot
Departures from a straight line indicate energy that Eq. (20) ignores (Figure 2a):
| Signature | Likely Cause |
|---|---|
| Straight line | Volumetric depletion; gas expansion is the only significant drive. |
| Concave-down (“bowed”) early trend, steepening later | Overpressured reservoir: rock and residual-fluid expansion supply energy at high pressure. Extrapolating early points overstates \(G\). |
| Flattening trend, \(p/Z\) staying high | Water drive: encroaching water shrinks the gas pore volume and supports pressure. |
| Flattening with apparent \(G\) smaller than \(G_{p}\) | Connected (leaky) reservoir supplying gas from a second tank. |
| Scatter about a line | Unstabilized pressures, datum errors or missing wells. |
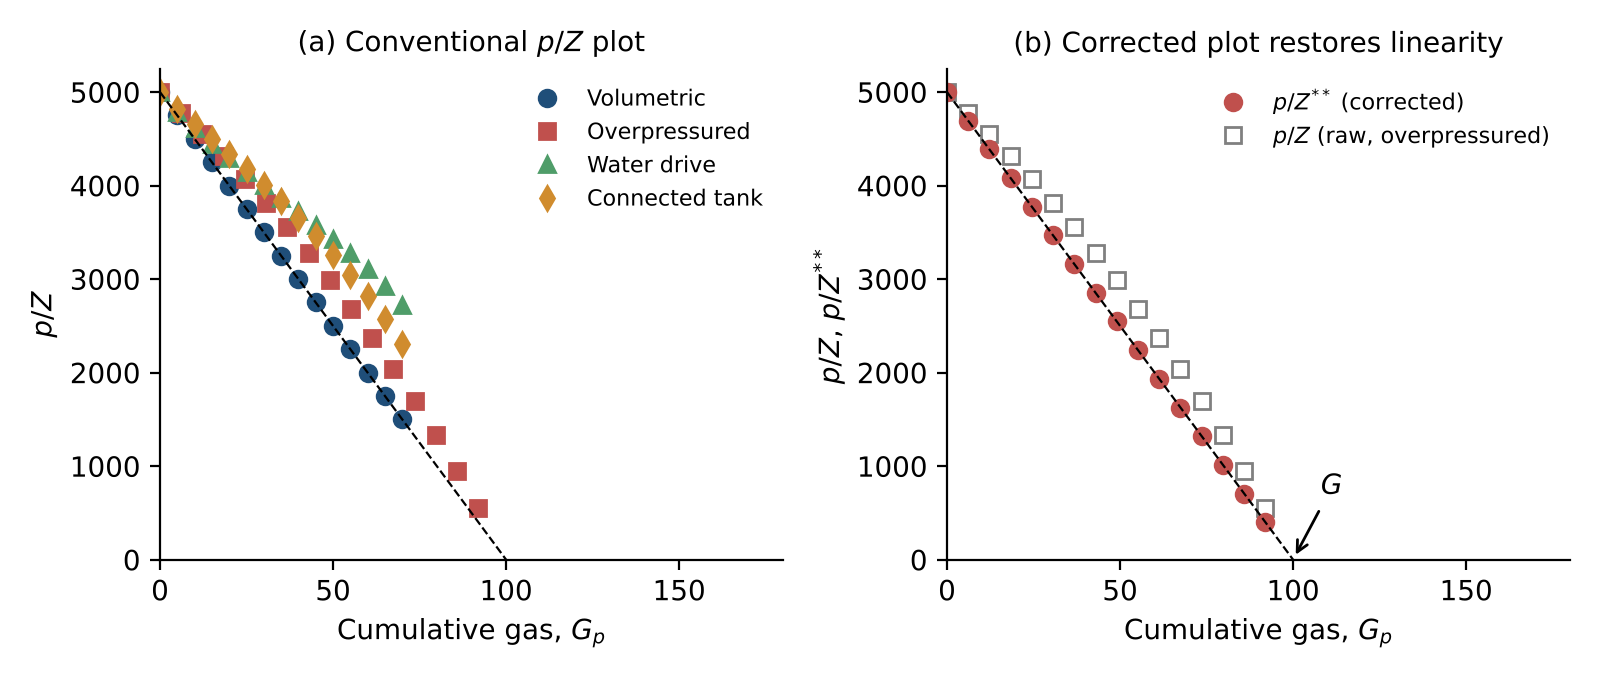 Figure 2. (a) Typical p/Z signatures. (b) Applying the corrected to overpressured data restores the straight line and the true . Illustrative data.
3.3. Corrected (generalized) gas material balance
When additional drives are significant, the straight-line interpretation can be preserved by folding them into a modified compressibility factor. The approach follows King’s for adsorbed gas and its extension to other mechanisms (, Moghadam et al.). The derivation below is a pore-volume budget for the gas zone.
3.3.1. Derivation
At pressure , the space available to gas equals the original gas pore volume, , less the volume lost to rock and water expansion and to net water influx. That space holds the gas still in the tank, including any gas received from a connected tank, :
Divide by and collect the non-gas terms into dimensionless fractions of the initial gas pore volume:
With from Eq. (19):
Defining
recovers the straight-line form:
Each correction term is zero for the mechanism it represents when that mechanism is absent, so Eq. (26) collapses to Eq. (20) for a volumetric reservoir. Because and contain , the solution is iterative: assume , compute at each survey, fit the line, update , and repeat until the fitted and assumed values agree.
3.3.2. Overpressured reservoirs
In overpressured reservoirs gas compressibility at initial conditions is low enough to be comparable with rock and water compressibility. Ignoring produces the bowed trend in Figure 2a and an optimistic if early data are extrapolated. The rigorous expression for is Eq. (7); where residual oil or condensate occupies part of the pore space, a term is added to its numerator. Pressure-dependent (common in unconsolidated or geopressured rock) is handled naturally by the integral form; the linear approximation, Eq. (8), is adequate only when is nearly constant.
3.3.3. Water-drive reservoirs
The term requires the cumulative water influx , which is not measured and must be computed from an aquifer model (Section 3.4). The aquifer parameters are adjusted, together with , until Eq. (26) is linear.
3.3.4. Connected reservoirs
The term requires the cumulative gas received from a second, unproduced tank of initial gas . The second tank depletes volumetrically:
and gas transfers between the tanks at a rate proportional to the pseudo-pressure difference:
and the transfer coefficient are found by history-matching. Water drive and connected-tank behaviour can look alike on a plot; the key difference is that water influx shrinks the gas pore volume while gas influx adds gas. A connected tank is indicated when the early trend extrapolates to a smaller than the gas already produced, or when water production does not increase as a water-drive model would predict.
3.4. Aquifer models
3.4.1. Fetkovich pseudo-steady-state aquifer
A finite aquifer depletes according to its own material balance. With initial water volume and total aquifer compressibility , the maximum encroachable water (aquifer pressure falling to zero) is
The aquifer’s average pressure is therefore related to the cumulative influx by
and, assuming pseudo-steady-state flow from aquifer to reservoir,
Differentiating Eq. (30) and substituting Eq. (31):
For a constant boundary pressure over an interval , Eq. (32) integrates to an exponential decline of . Integrating Eq. (31) over the interval then gives the influx increment:
where is the average boundary pressure over the step and is updated from Eq. (30) after each step. The two parameters, and , can be estimated from aquifer geometry and properties but are usually adjusted to match the pressure history. Unsteady-state models (van Everdingen–Hurst) may be used where infinite-acting aquifer behaviour must be represented more rigorously.
3.5. Limitations
- The and methods assume dry gas. For wet gas, convert produced condensate and water vapour to gas equivalent and add them to . For gas condensates below the dew point, use a two-phase factor or the generalized formulation of Section 5.
- Early-time data in overpressured or water-drive reservoirs carry little diagnostic power because the correction terms are still small; at least 10–20 % depletion is usually needed before the trend is reliable.
4. Oil Material Balance
The oil MBE contains more unknowns (, or , and aquifer parameters) than a single pressure survey can resolve. Instead of solving for at individual pressures, the recommended practice is to rearrange the equation into forms that plot as straight lines or that can be compared directly with measured pressures, and to use the departures as diagnostics.
4.1. Havlena–Odeh plot (all reservoir types)
Dividing Eq. (16) by the oil-zone expansion gives an equation of a straight line:
On a plot of against (Figure 3) the intercept is the oil in place and the slope is the free (gas-cap) gas in place . Water influx must be supplied from an aquifer model; if it is omitted when present, the points curve upward, which is itself a sign of water drive. The analyst can move the line in three ways:
- shift it vertically — changes with fixed;
- rotate about a point on the data — changes and together;
- rotate about the intercept — changes with fixed.
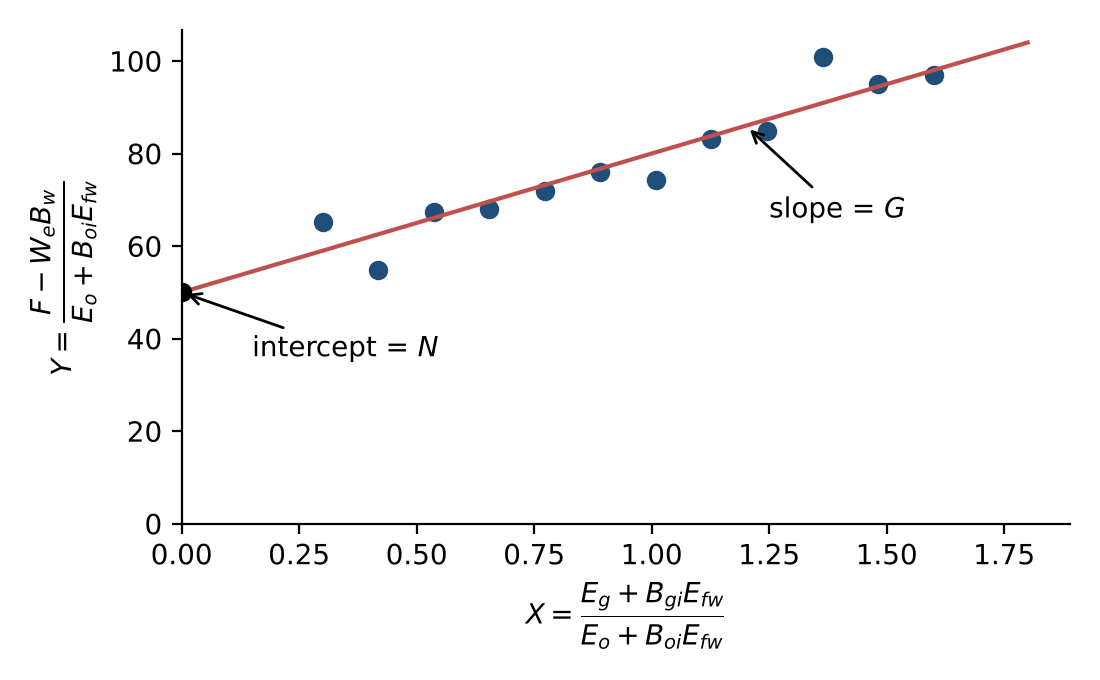 Figure 3. Havlena–Odeh plot for a reservoir with a gas cap. The intercept gives and the slope gives . Illustrative data.
Small pressure or PVT errors magnify scatter in and , especially early in depletion when the expansion terms are small. For an undersaturated oil the numerator of is zero, and the plot degenerates; use Section 4.2 instead.
4.2. F versus Et (no initial gas cap)
With no free gas initially (, ), Eq. (15) reduces to
so the net withdrawal plotted against total expansion is a straight line through the origin with slope (Figure 4). The same plot is useful with a gas cap — with — as a consistency check of a proposed pair.
| Shape | Interpretation |
|---|---|
| Straight line through origin | Model consistent: volumetric depletion, or all external drives correctly included. |
| Concave upward | Energy is missing from the model — unaccounted water influx, injection, a connected reservoir, or \(N\) (or \(m\)) too small. |
| Concave downward | The model contains too much energy — production from unmodelled wells, compressibility over-estimated, a declining influx, or \(N\) (or \(m\)) too large. |
| Isolated low point | Pressure not stabilized at the time of the survey, or a production or PVT error at that date. |
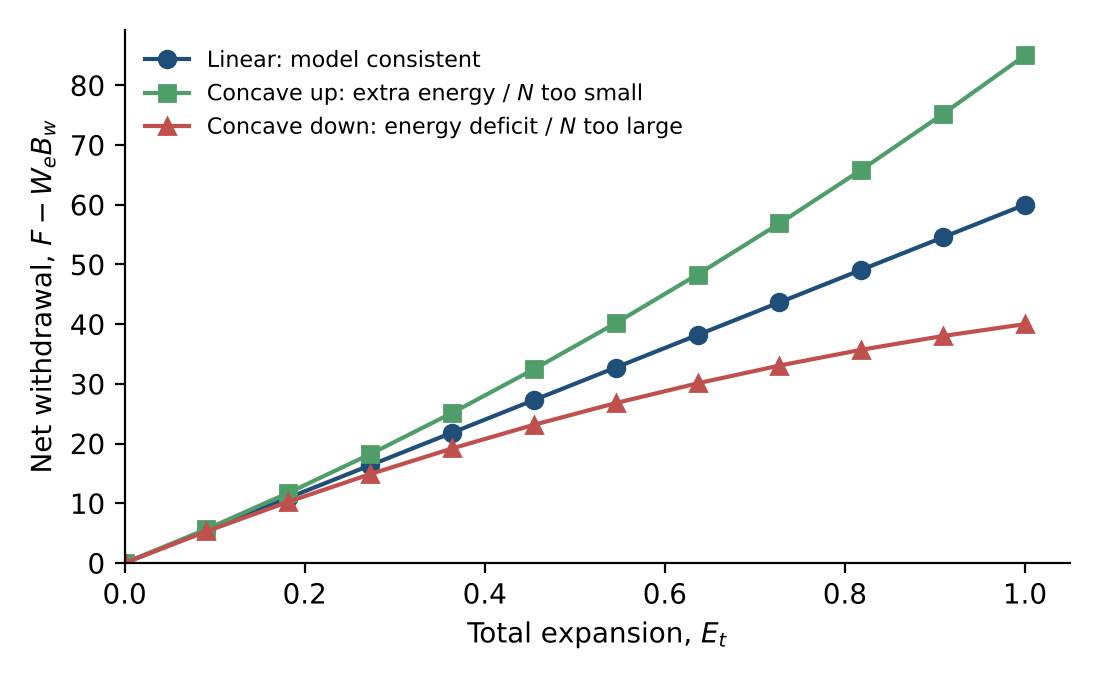 Figure 4. F versus signatures. Illustrative data.
4.3. Water-drive form
When an aquifer is present and no gas cap exists, dividing Eq. (35) by gives
With the correct aquifer model, versus is a straight line of unit slope and intercept . A slope other than one, or curvature, indicates that the aquifer size or strength is wrong.
4.4. Oil in place versus time
Solving Eq. (35) for at each survey,
and plotting against time tests the assumed drive mechanism. A flat trend supports the model; a rising trend means energy is missing (aquifer, compaction, connected volume); a falling trend usually means not all producing wells are assigned to the reservoir. Because each point uses a single pressure, this plot is noisy and is best used as a supporting diagnostic.
4.5. Pressure diagnostics
Pressure versus cumulative oil and pressure versus time should be examined before any analysis. Typical features include:
- a change in slope at the bubble point, where liberated gas begins to supply energy and the decline slows;
- rising pressures marking the start of water or gas injection;
- flat pressures suggesting aquifer support (or, in tight reservoirs, that pressures are not yet representative of the drainage volume);
- outlying wells whose pressures do not follow the field trend and may not be in communication.
4.6. Pressure history match (synthetic pressure)
The most robust test of a material balance model is to compute the reservoir pressure it predicts and compare it with measurements. For trial values of , and aquifer parameters, at each time solve for the pressure that satisfies the MBE:
depends on through the PVT properties, and through the aquifer model, so is solved iteratively (for example by bisection or Newton’s method), marching forward in time. The calculated pressure history is then plotted against the measured static pressures (Figure 5).
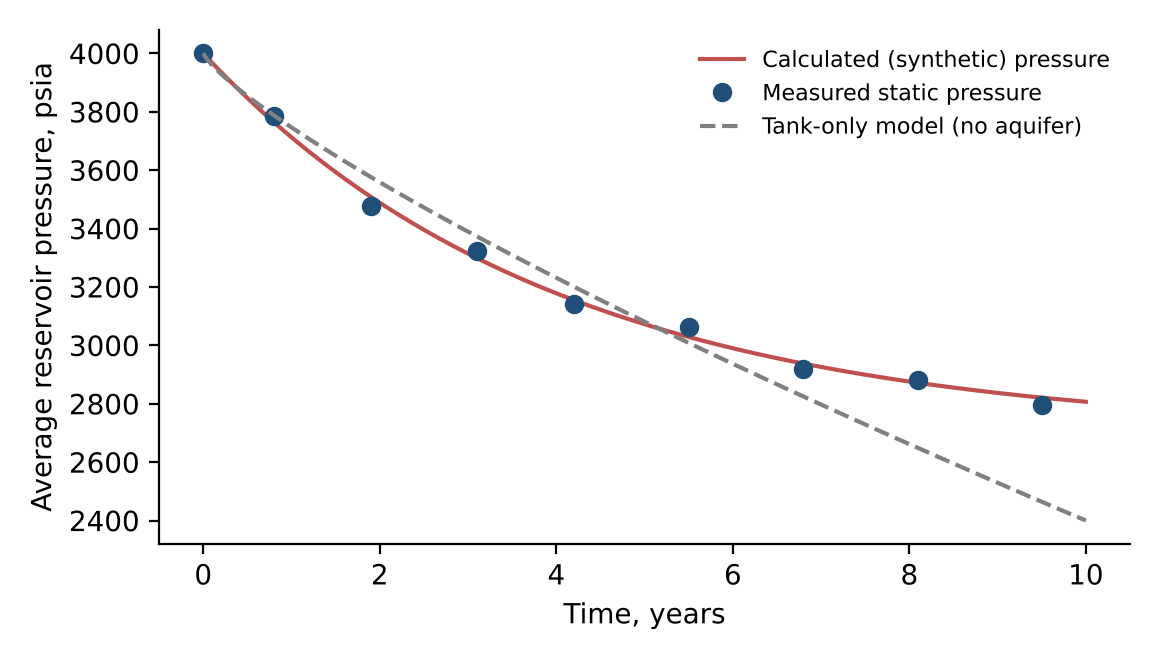 Figure 5. Pressure history match. The tank-only model under-predicts pressure; adding an aquifer reproduces the measured trend. Illustrative data.
Working in pressure and time has practical advantages: the effect of shut-ins, rate changes, injection start-up and time-dependent influx is visible directly. A reliable workflow is:
- Start with the simplest model (depletion only) and add mechanisms only when the match demands them.
- Match from early to late time: initial pressure first, then early depletion, then late-time behaviour. Aquifer and connected-tank effects are small early and grow with time.
- Recognize non-uniqueness — several combinations of , and may match equally well; use volumetrics and other data to discriminate.
Poor early-time matches usually point to PVT errors, because the expansion terms are small and sensitive to , and . Isolated misfits point to bad pressures or production data at those dates.
4.7. Drive indices
Dividing the MBE by the hydrocarbon withdrawal expresses each mechanism as a fraction of the total:
| Index | Mechanism |
|---|---|
| DDI | Depletion (solution-gas) drive — expansion of oil and liberated gas |
| SDI | Segregation (gas-cap) drive |
| WDI | Natural water drive (net of produced water) |
| CDI | Compaction and connate-water expansion |
| IDI | Pressure maintenance by injection |
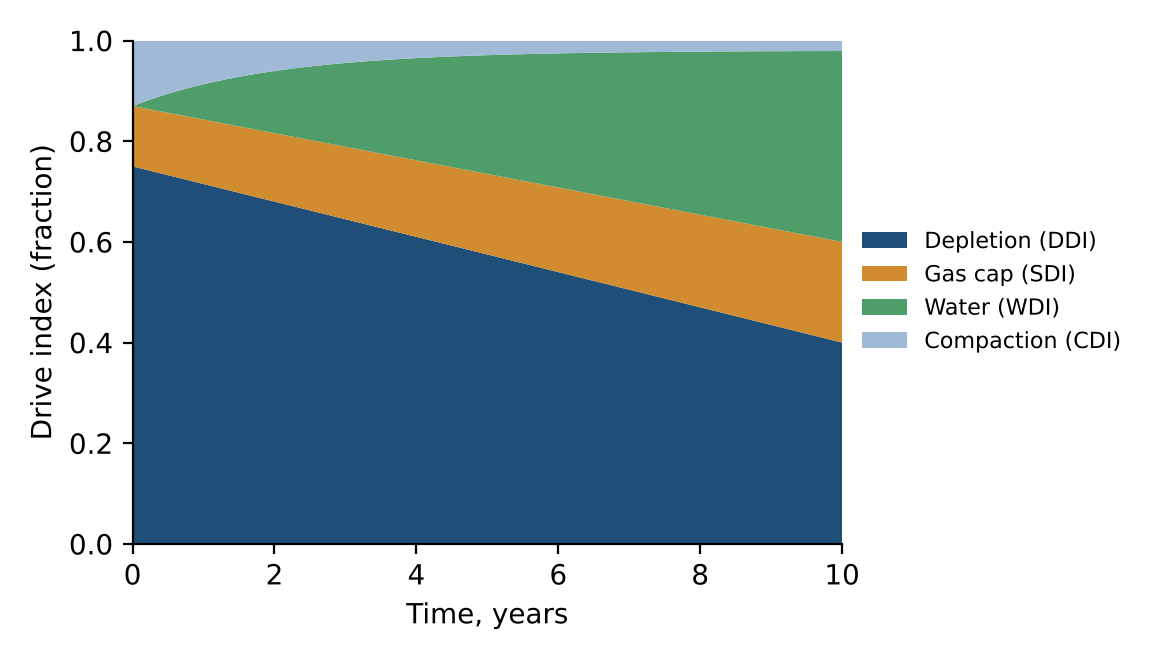 Figure 6. Cumulative drive indices for a reservoir with a gas cap and a developing aquifer. Illustrative data.
Drive indices are cumulative and change with time (Figure 6). They provide a check on the solution: if the sum departs materially from unity — a practical tolerance is 0.95 to 1.05 — or trends steadily up or down, the MB solution is not consistent with the data. Common causes are mis-stated withdrawals or an incomplete set of energy terms.
4.8. Dake and Campbell diagnostic plots
Both plots assume a volumetric reservoir with no gas cap and look for departures from that assumption.
Dake plot. From Eq. (36), . Plotting (here , with constant ) against or time gives a horizontal line at for pure depletion. Any additional energy — water influx or an unrecognized gas cap — makes rise.
Campbell plot. is plotted against , with including gas-cap expansion when one is present. Plotting against withdrawal rather than time makes the plot more sensitive to aquifer strength. Typical signatures are shown in Figure 7.
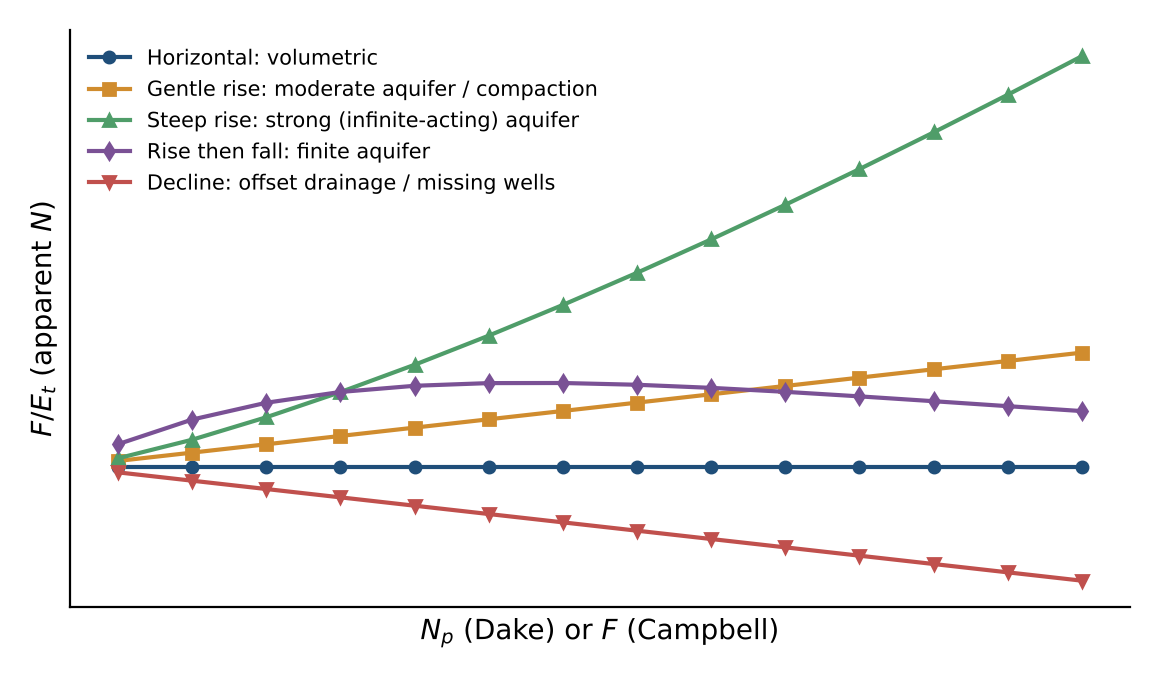 Figure 7. Diagnostic signatures on Dake and Campbell plots.
| Trend | Interpretation |
|---|---|
| Horizontal | Volumetric reservoir; energy from oil, solution gas and normal compaction only. |
| Gentle rise | Moderate water influx or abnormal pore compaction. |
| Steep, continuing rise | Strong, infinite-acting aquifer. |
| Rise then fall | Finite aquifer: support fades as the aquifer depletes. |
| Decline | Weak aquifer, or pressure lost to offset production or unassigned wells. |
These plots, like the -versus-time plot, are qualitative. When pressure surveys are infrequent, trends may not be identifiable.
5. Volatile Oil and Gas Condensate (Generalized MBE)
Conventional black-oil MB assumes the gas phase carries no liquid. In volatile oils (typically scf/STB, API gravity above about 40°) and gas condensates, the free gas contains significant vaporized oil, described by the solution oil–gas ratio (STB/scf). Ignoring overstates oil recovery from the oil zone and misallocates surface gas and oil between phases.
The generalized MBE (Walsh) tracks stock-tank oil and surface gas in both reservoir phases. Let be the oil initially in the free-oil phase and the gas initially in the free-gas phase. The totals are
Withdrawal is converted to reservoir volumes by splitting surface production back into reservoir oil and gas phases:
The oil- and gas-phase expansivities become
and the balance, analogous to Eq. (16), is
Setting recovers the black-oil forms: Eq. (41) becomes Eq. (10), Eq. (42) becomes Eq. (12), and becomes . All plots in Section 4 apply unchanged with these definitions; for example, the Havlena–Odeh intercept and slope now give and , from which and follow through Eq. (40). For a gas condensate with no initial oil phase, and Eq. (44) yields directly.
6. Recommended Workflow
- Assemble and check data. Reconcile production and injection volumes by well; correct pressures to datum; validate PVT (consistency of , , at the bubble point; for volatile systems).
- Inspect pressure trends against time and cumulative production to identify the bubble point, injection start, aquifer support and anomalous wells.
- Select the reservoir type — gas or oil; gas cap or not; volatile or black oil.
- Apply the simplest model. For gas, the plot; for oil, F versus or Havlena–Odeh.
- Diagnose departures using the shape of the primary plot, versus time, and Dake or Campbell plots.
- Add mechanisms only as needed — compaction (rigorous ), aquifer, connected tank — and refine with the or pressure history match.
- Validate the solution. Drive indices should sum to about one; the synthetic pressure should match measured pressures; and should be consistent with volumetric estimates.
- Document non-uniqueness by reporting the range of solutions that match equally well.
Nomenclature
| Symbol | Description | Field units |
|---|---|---|
| Gas formation volume factor | rb/scf | |
| Oil formation volume factor | rb/STB | |
| Water formation volume factor | rb/STB | |
| Effective oil-zone compressibility | psi⁻¹ | |
| Pore-volume (formation) compressibility | psi⁻¹ | |
| , | Oil and water compressibility | psi⁻¹ |
| Oil plus dissolved-gas expansion | rb/STB | |
| Gas-cap expansion (per STB, Eq. 13; per scf, Eq. 43) | rb/STB, rb/scf | |
| Connate-water and pore-volume expansion | rb/STB | |
| Total expansion | rb/STB | |
| Fractional HCPV reduction from rock and water expansion | – | |
| Net underground withdrawal | rb | |
| Original free gas in place | scf | |
| Cumulative gas influx from a connected tank | scf | |
| , | Aquifer and inter-tank transfer coefficients | STB/d/psi; scf/d/(psi²/cp) |
| Initial gas-cap to oil-zone volume ratio | – | |
| Real-gas pseudo-pressure | psi²/cp | |
| Original oil in place | STB | |
| , | Average and initial reservoir pressure | psia |
| Cumulative produced gas–oil ratio | scf/STB | |
| Solution gas–oil ratio | scf/STB | |
| Solution oil–gas ratio (vaporized oil) | STB/scf | |
| Initial water saturation | fraction | |
| Reservoir temperature | °R | |
| Cumulative water influx | STB | |
| Maximum encroachable water (Fetkovich) | STB | |
| , | Gas deviation factor and corrected deviation factor | – |
| , | Water- and gas-influx fractions of initial gas pore volume | – |
References
- Dake, L.P. 1978. Fundamentals of Reservoir Engineering. Amsterdam: Elsevier.
- Walsh, M.P. and Lake, L.W. 2003. A Generalized Approach to Primary Hydrocarbon Recovery. Amsterdam: Elsevier.
- Schilthuis, R.J. 1936. Active Oil and Reservoir Energy. Trans. AIME 118: 33–52.
- Havlena, D. and Odeh, A.S. 1963. The Material Balance as an Equation of a Straight Line. J. Pet. Tech. 15 (8): 896–900.
- Fetkovich, M.J. 1971. A Simplified Approach to Water Influx Calculations — Finite Aquifer Systems. J. Pet. Tech. 23 (7): 814–828.
- van Everdingen, A.F. and Hurst, W. 1949. The Application of the Laplace Transformation to Flow Problems in Reservoirs. Trans. AIME 186: 305–324.
- Campbell, R.A. and Campbell, J.M. 1978. Mineral Property Economics, Vol. 3: Petroleum Property Evaluation. Norman, Oklahoma: Campbell Petroleum Series.
- King, G.R. 1993. Material-Balance Techniques for Coal-Seam and Devonian Shale Gas Reservoirs With Limited Water Influx. SPE Res. Eng. 8 (1): 67–72.
- Moghadam, S., Jeje, O. and Mattar, L. 2011. Advanced Gas Material Balance in Simplified Format. J. Can. Pet. Tech. 50 (1): 90–98.
- Walsh, M.P., Ansah, J. and Raghavan, R. 1994. The New, Generalized Material Balance as an Equation of a Straight Line: Part 1 — Applications to Undersaturated and Volumetric Reservoirs; Part 2 — Applications to Saturated and Non-Volumetric Reservoirs. SPE 27684 and SPE 27728.