Nodal Analysis - Gas Lift Designer
1. Overview
This gas lift design module within the Nodal Analysis section is intended to:
- Perform new gas lift designs for IPO (injection pressure operated) valves and orifices. This means placing valves such that kill/completion fluid can be displaced, and determining gas lift valve pressure settings (surface opening and closing pressures and test rack open pressures at 60 °F) such that one can reach deeper valves by sequentially closing shallower ones.
- Evaluate existing gas lift designs with IPO valves and orifices. In this case, the user should bypass the mandrel spacing and instead directly input valve depths, types, sizes, surface opening pressures, and ptro,60 values into the table.
The gas lift design module follows most of the workflows, equations, logic, and nomenclature of SNAP, which was acquired by whitson in September 2025.
There are several limitations to the module, as follows.
- The gas lift design module is meant for continuous gas lift installations.
- Multi-pointing (i.e. flowing through two or more valves simultaneously) can be detected, but not modeled.
- It currently does not include IPO valve flow calculations using the VPC (valve performance clearinghouse) model. It does support Thornhill-Craver and Winkler. Orifice flow is always calculated using Thornhill-Craver.
- The current version of the gas lift design module does not plot valve performance curves.
- Bellows pressure calculations neglect the effect of silicone oil inside the bellows chamber.
- Frictional pressure drops in the injection conduit are neglected.
2. Functionality
The image below shows an overview of the gas lift design module. The general workflow follows boxes one through seven.
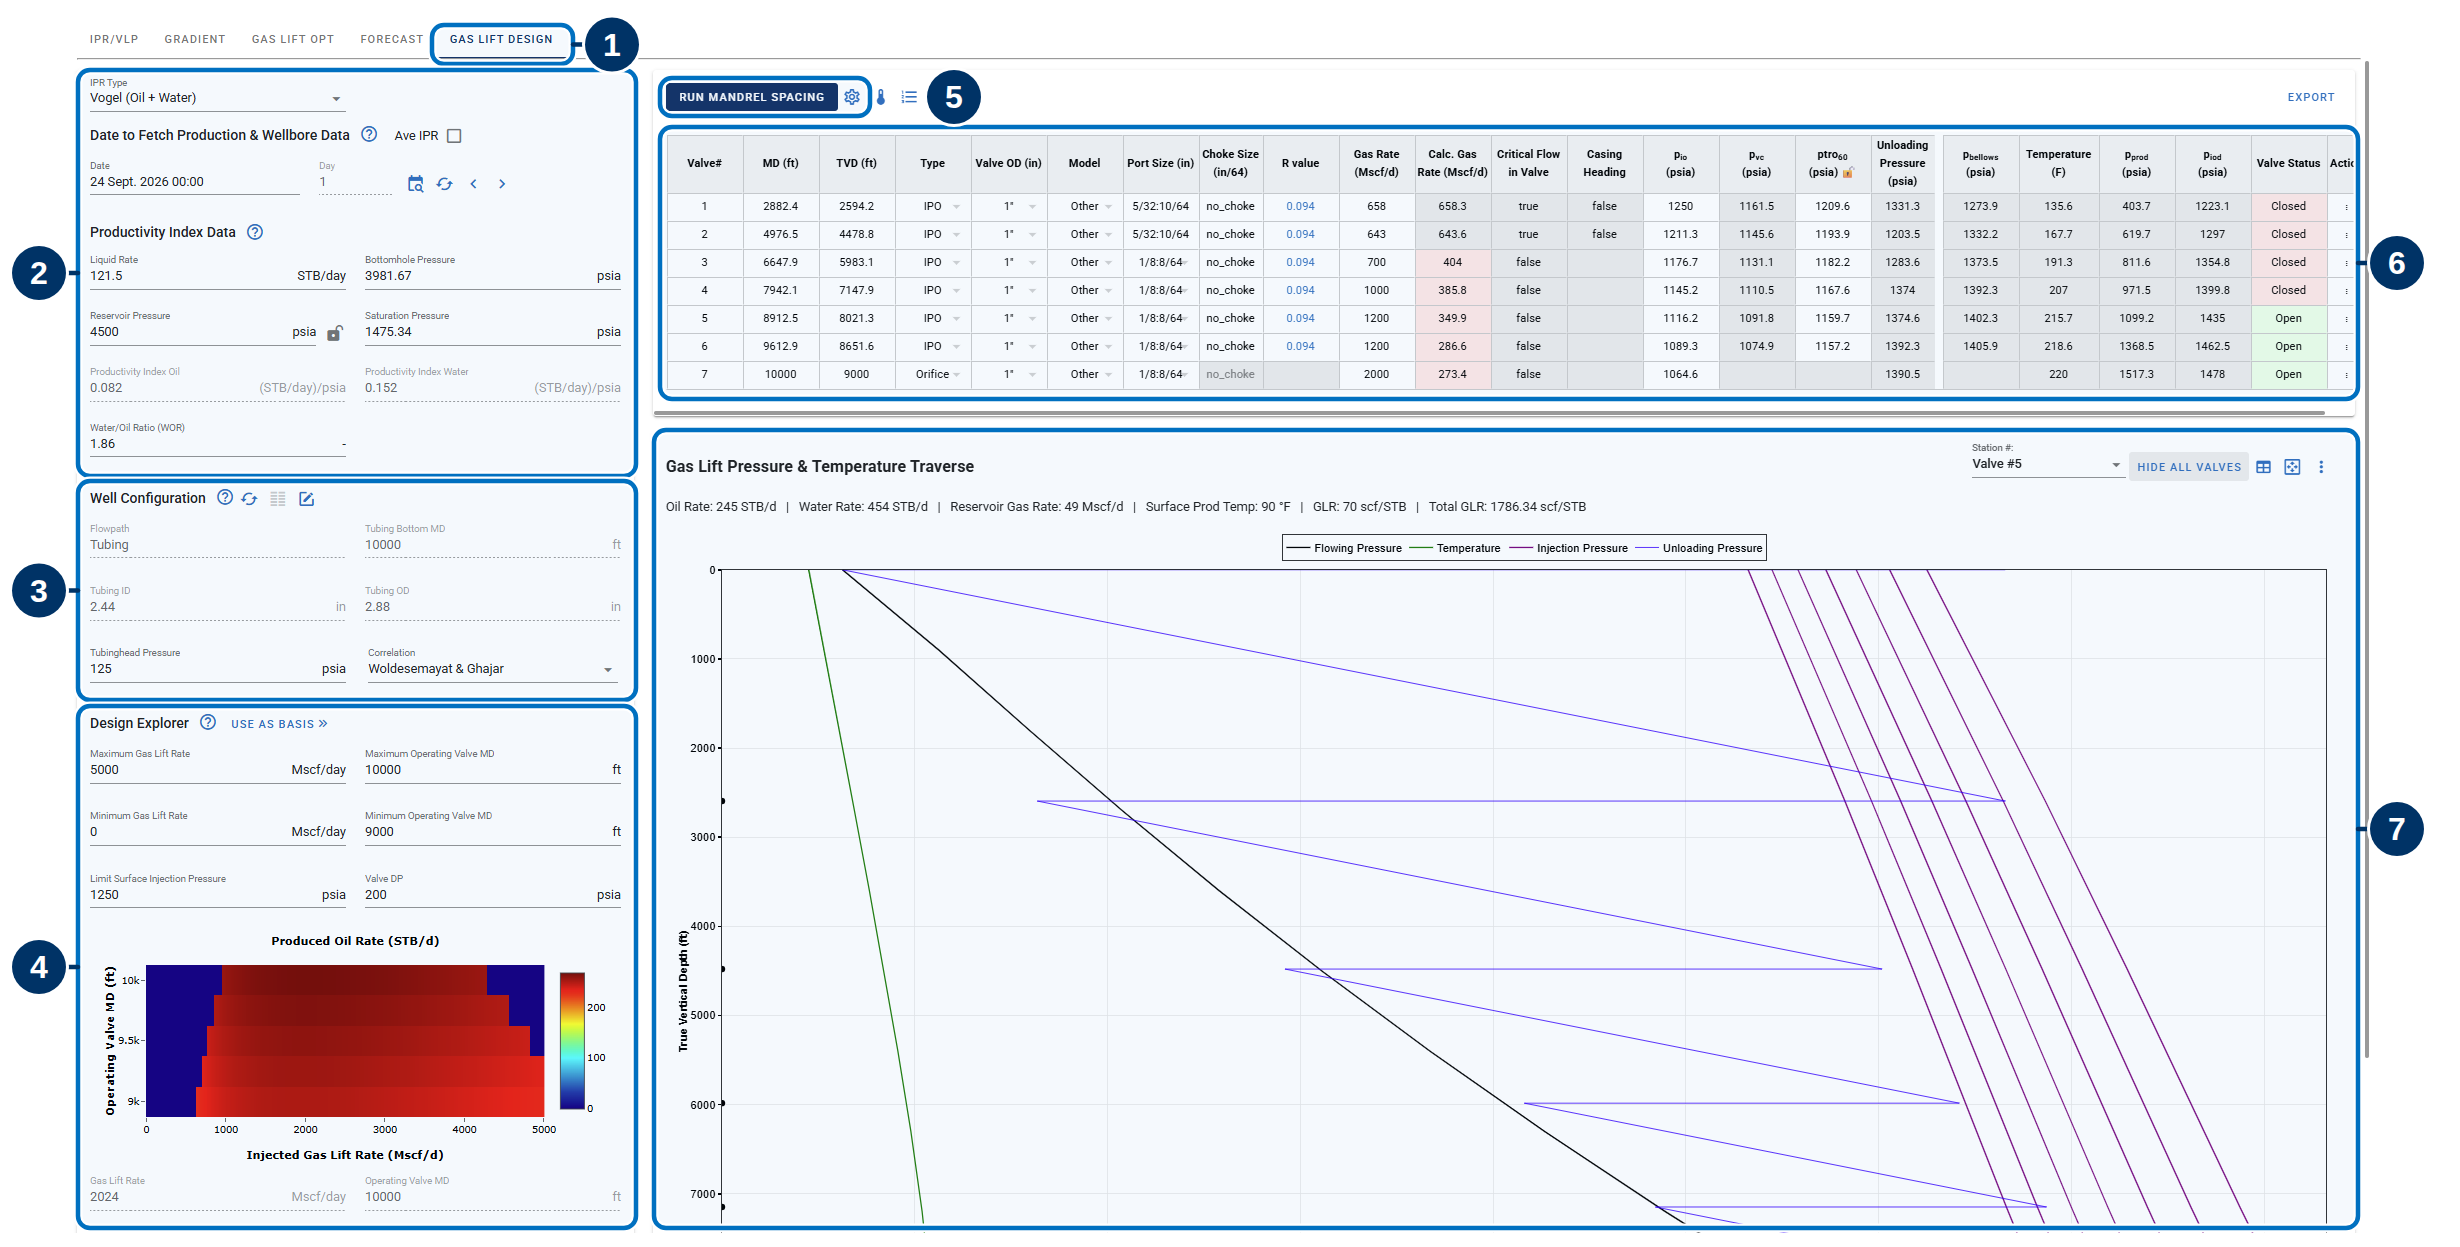
As a basis, the user must specify the IPR curve and gas lift configuration that will be used.
- IPR Curve: Displays information about the date, rates, and bottomhole pressure used to estimate reservoir inflow performance (IPR). This IPR will be used as a basis for the gas lift design. The user can use the average IPR option or select another date. Clicking on the "refresh" icon will update to the most recent data for that date. Well IPR type can be Vogel or C&n.
-
Well Configuration: Displays some additional information about the well, namely tubing depth, ID, OD, tubinghead pressure, and the multiphase pressure drop correlation that will be used for the design. Clicking on the "refresh" icon will update to the most recent data for that date. One can edit the values by clicking on the "edit" icon. Gas lift injection through either the annulus or the tubing is supported.
For the module to work, the well does not need to have a current gas lift configuration. If it does not have a current gas lift configuration, then the choice to produce through the tubing (regular gas lift) or through the annulus (reversed gas lift) will be dictated by the flowpath of the current configuration.
2.1 Design Explorer
The purpose of the Design Explorer is to help find a preliminary operating valve depth and gas lift injection rate that are achievable with the available surface injection pressure and assuming an operating gas lift valve pressure drop.
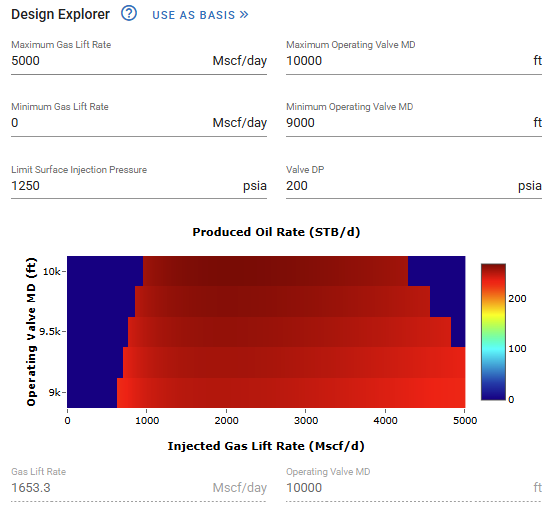
The user specifies a range of valve depths (for example from wellhead to end of tubing) and a range of gas lift rates, and the utility runs all combinations and reports (using a color map) either oil or gas rates (depending on whether the IPR is Vogel or C&n) for all of them. The user can "zoom in" on a particular region by changing the min and max values (be aware it will take some time to update).
The utility also calculates the required surface injection pressure of each combination by taking the production pressure at the injection depth, adding the user-specified valve pressure drop, and converting to wellhead conditions considering the hydrostatic pressure of the dry gas column. The calculated surface injection pressure is then compared against the user-input surface injection pressure; if higher, the calculated oil (or gas) rates are overridden with zeroes. The user can pick a valve depth/gas lift rate combination (by left-clicking on the chart), and then click on "USE AS BASIS" to copy the values to the valve table.
2.2 Mandrel Spacing Utility
When the "Run Mandrel Spacing" button is clicked, the software will generate a full valve table with a preliminary design that must be refined. The spacing is based on the IPO spacing method available in SNAP.
The gear icon allows you to change the mandrel spacing settings.
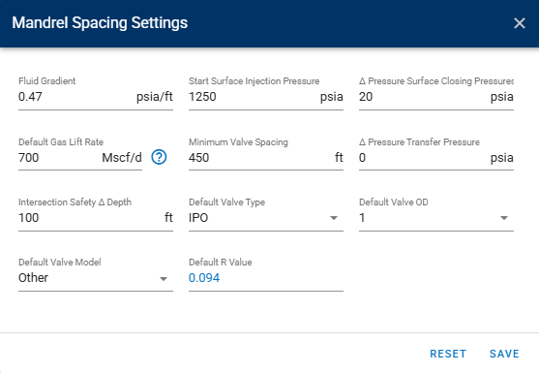
A description of each variable name is as follows.
| Variable | Description |
|---|---|
| Fluid Gradient | Gradient of completion/kill fluid. |
| Start Surface Injection Pressure | Surface opening injection pressure for the first valve. |
| Default Gas Lift Rate | Unloading gas lift rate, usually some percentage of the operating valve injection rate (rule of thumb: 30% of the final rate for the first three valves, 50% for the next three valves, 70% for the remaining valves). This value is not used for the spacing; it is only required to pre-populate the valve table. |
| Δ Pressure Surface Closing Pressures | During unloading, one reduces the surface opening injection pressure by some amount to close the current valve and open the valve below. This user input gives some desired delta between the surface closing pressures (which are directly related to the surface opening injection pressures) that will be used during the spacing. Be aware that, during the spacing process, the production pressure profile is assumed to be constant, while in the gas lift design module, it will be updated for each valve depending on their IPR-VLP intersection, so the actual surface closing pressures displayed on the table might not have the exact spacing specified by the user. |
| Minimum Valve Spacing | When the spacing between the valves gives a value below this, it will stop spacing valves and exit. |
| Δ Pressure Transfer Pressure | During spacing, the unloading lines for a given valve are drawn from the production pressure at the previous valve. The user can add a delta to the production pressure for more conservative spacing. |
| Intersection Safety Δ Depth | The valve location is typically found by intersecting the kill/completion fluid pressure line and the injection conduit pressure line. The user can add a safety margin by placing the valve some distance above the intersection. |
| Default Valve Type, OD, Model and R Value | Values that will be used to pre-populate the valve table after the spacing results are copied. The R value is the only value used during spacing (to convert between the surface closing pressure and the surface opening injection pressure). |
2.3 Valve Table
When the operating valve is initially copied to the valve table from the Design Explorer, it may look like this:

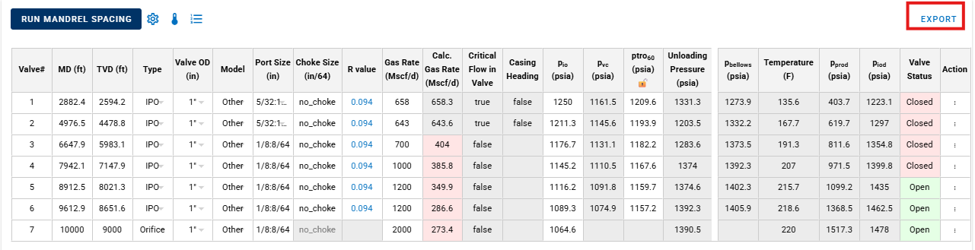
Cells with white background are user-input, while cells with another background are software-calculated. Be aware different valve types (IPO, orifice or dummy) have different required inputs. Red backgrounds indicate that user attention is required. The "RUN MANDREL SPACING" button will pre-populate many of the fields.
A description of each column in the table is as follows.
| Column | Description |
|---|---|
| Valve # | Valve number. By clicking on the icon in the figure below, one can change the numbering to run from shallowest to deepest, or from deepest to shallowest.

|
| MD/TVD | Valve measured depth / true vertical depth. This is a user-input column. Only one is required; the other will be automatically calculated from the well deviation survey. |
| Type | Orifice, IPO, or dummy. This is a user-input column. Orifice is typically used for the operating valve, IPO for unloading, and dummy is a blank mandrel that can be used in the future (i.e., after depletion). |
| Valve OD | Gas lift valve pocket size (1" or 1.5"). This is a user-input column. |
| Model | Gas lift valve models available in SNAP. This is a user-input column. "Other" represents a generic gas lift valve that has all port and choke sizes available and uses the user-input R value. Valves of model "Other" use the Thornhill-Craver model to calculate flow across the valve. Valves of all other models use the Winkler model to calculate flow across the valve. |
| Port Size | Port size in inches. This is a user-input column. |
| Choke Size | Choke size in 1/64 inches. This is a user-input column. Only available for IPO valves. |
| R Value | Ratio of port area to bellows area. This is a user-input column (it depends on model and port size, but the user can override the library value if needed). |
| Gas Rate | User-input (desired) gas rate through the valve. It should be close to the value in the column on its right. This is a user-input column. |
| Calc. Gas Rate | Calculated gas rate through the valve using the injection and production pressures at valve depth, the valve port and choke size, the ptro,60 value, and the Thornhill-Craver or Winkler model. This is a software-calculated column. |
| Critical Flow in Valve | A true/false flag indicating whether the valve is operating in the critical regime. This is a software-calculated column. |
| Casing Heading | Applies the Wim der Kinderen / Dick ter Avest stability criteria to detect if the valve is at risk of experiencing casing-heading instability. This is a software-calculated column. It is calculated only when the "Gas Rate" and "Calc. Gas Rate" values are close enough. |
| pio | Opening injection pressure at surface. This is a user-input column. |
| pvc | Surface closing pressure (bellows pressure translated to surface when the injection pressure at surface is applied). This is a software-calculated column. |
| ptro,60 | Test rack opening pressure at 60 °F. This column can be software-calculated or user-input, and is normally calculated by the software. When the lock icon is open, the software calculates the value dynamically. When the lock icon is closed, the value is frozen (either from user input or a previous software calculation). |
| Unloading Pressure | Pressure required to unload the hydrostatic column of completion/kill fluid at depth. This is a software-calculated column. It is calculated using the completion fluid gradient and the production pressure when there is injection through the valve above. For the first valve, it is calculated using the wellhead pressure. |
The following columns update depending on the value of the "Station #" selector (located at the top-right corner of the gradient plot utility). All of these columns are software-calculated. Values displayed are valid when there is injection through the valve displayed in the "Station #" selector.
| Column | Description |
|---|---|
| pbellows | IPO valve bellows pressure. |
| Temperature | Temperature at valve depth. |
| pprod | Production pressure at valve depth. |
| piod | Pressure in the injection flowpath (usually the annulus) at valve depth. This is the pressure upstream of the valve. |
| Valve Status | Open or closed. For IPO valves it is calculated according to the force balance on the valve. Always open for orifices. |
The Action column, when clicked, allows the user to add or delete rows.
2.4 Gradient Plot Utility
The gradient plot utility displays, versus depth, pressures in the production and injection conduits, the pressure in the completion fluid column, and the temperature. Above the chart, the equilibrium (IPR-VLP intersection) rates of oil, gas and water are printed. Un-checking the option "HIDE ALL VALVES" shows the profiles of injection pressure and unloading lines for all valves.
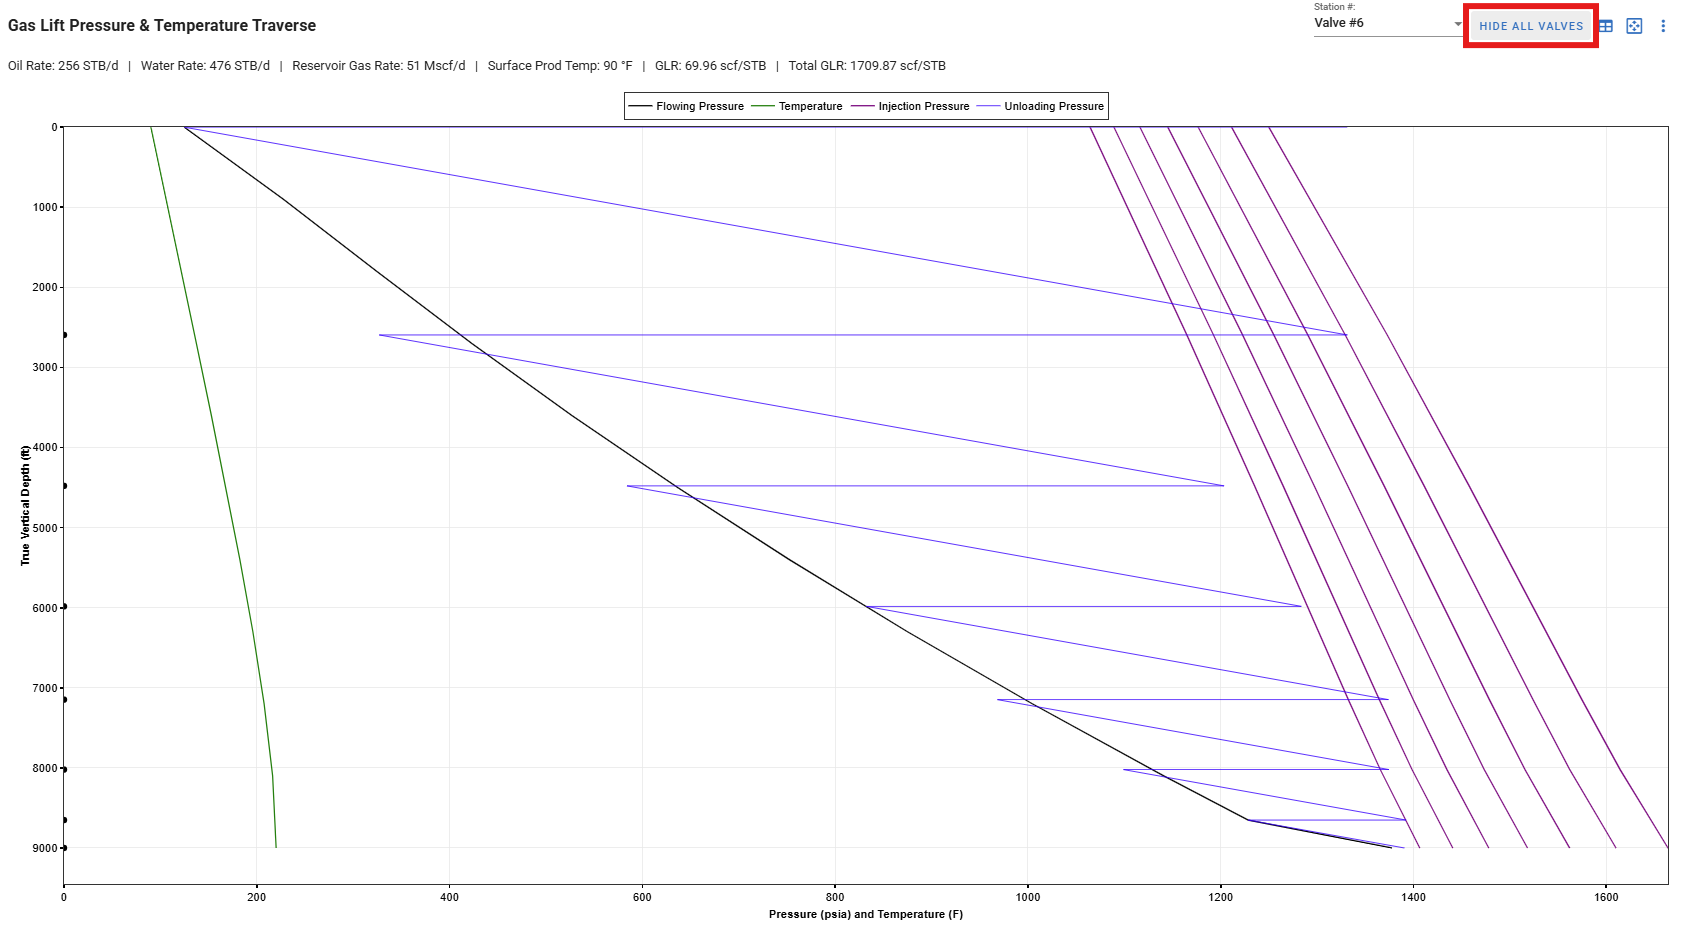
The GIF below illustrates how the gradient plot (produced by the intially selected operating valve depth and gas lift rate) is used to perform mandrel spacing. In the example below, we are injecting lift gas down the casing. The black line is the tubing pressure profile with no head of kill/completion fluid inside the tubing. The red line represents the pressure profile of the fluid in the tubing. The purple lines represent the available injection pressure profile for each valve. The difference between surface injection pressures for each valve (top of purple line) is related to the Δ Pressure Surface Closing Pressures, specified in the Mandrel Spacing Settings.
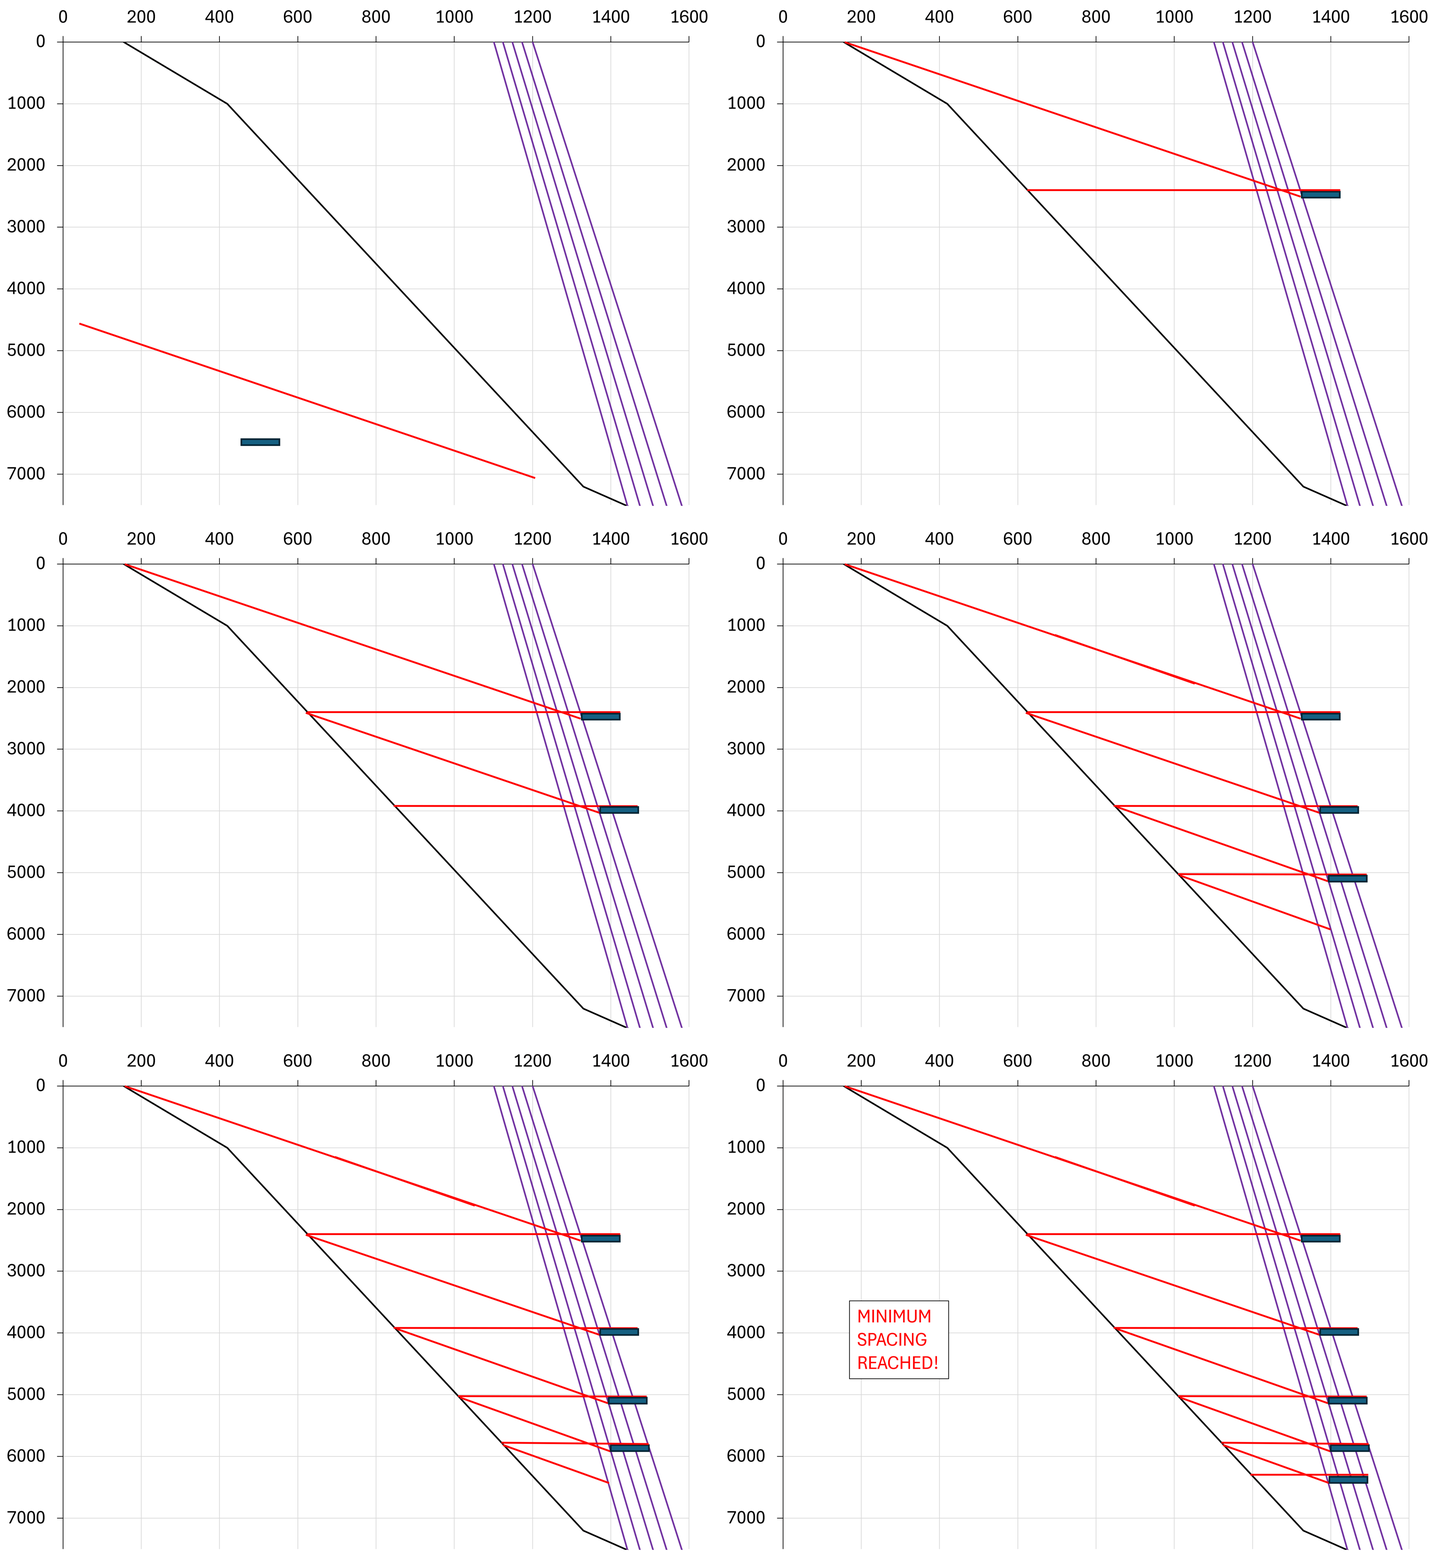
To generate this plot, the workflow is:
- From the tubinghead, plot the pressure gradient as if the tubing were full of kill/completion fluid (red diagonal line).
- Once the hydrostatic pressure of the fluid in the tubing is equal to the available injection pressure for that valve at said depth (red line intersects purple line), the maximum valve depth is reached.
- Add a safety factor (the intersection safety delta depth) to place the valve slightly shallower.
- Assume that at that depth, all the kill fluid has been unloaded, and repeat steps 1 to 3 until the minimum spacing is reached.
3. Workflow
The flow diagram below provides an overview of a typical gas lift design workflow in whitson+.
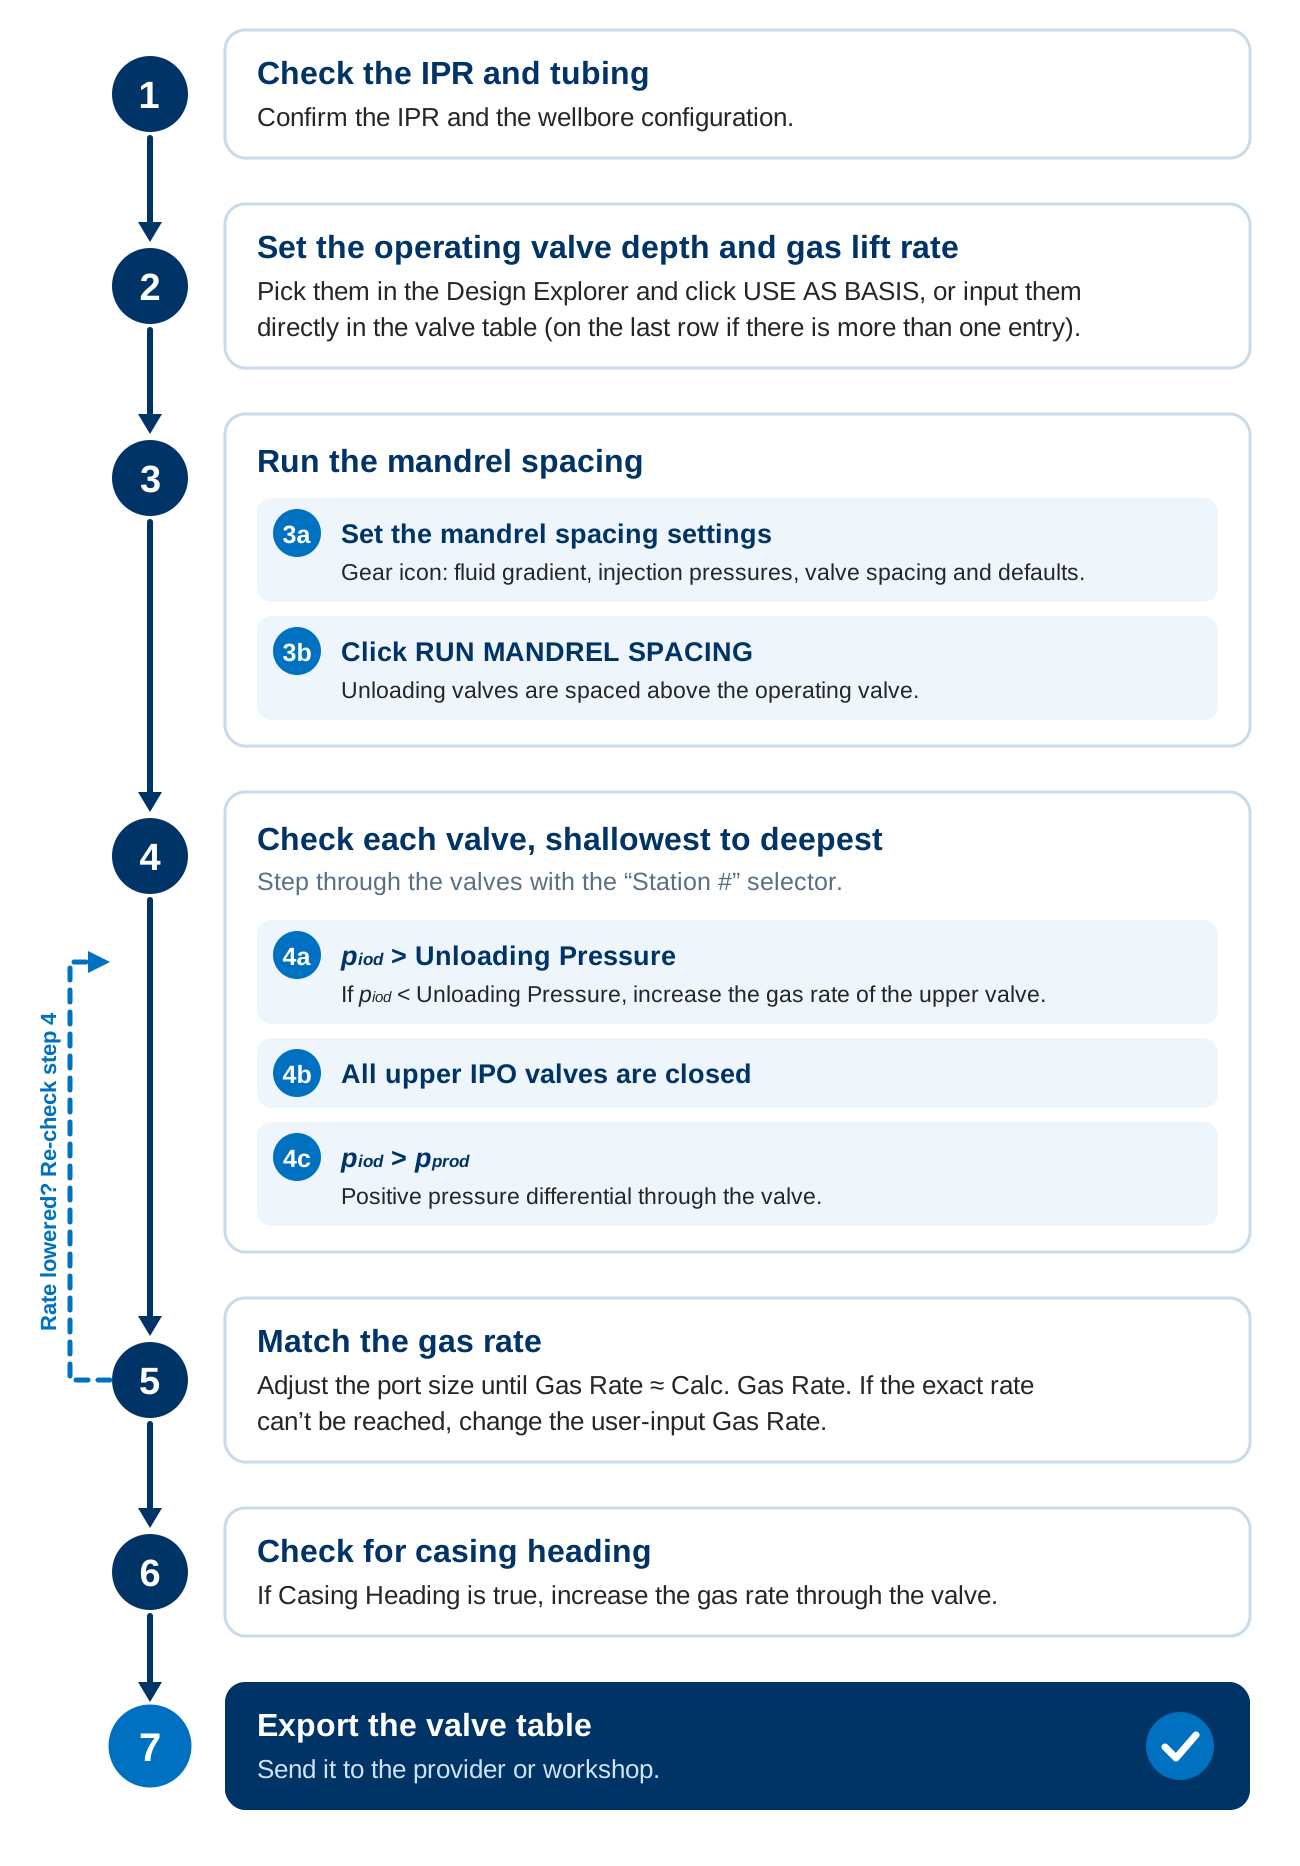
A more detailed explanation of each step is as follows.
- Ensure the IPR used for the design is satisfactory and that the proper tubing size and length are used.
- Use the Design Explorer to determine the optimal operating valve depth and gas lift rate that are within the available surface injection pressure. Select a combination and click on "USE AS BASIS". Alternatively, manually input the operating valve depth and gas rate in the valve table.
- Run the mandrel spacing by clicking "RUN MANDREL SPACING".
- With the newly populated valve table, check the following (sequentially, valve by valve, from shallowest to deepest, using the "Station #" selector located in the upper right corner of the gradient plot utility):
- When injecting through any given valve, the injection pressure at valve depth should be greater than the unloading pressure (at selected valve row, column "piod" > column "Unloading Pressure"). If this is not the case (the column "Unloading Pressure" will be shaded with a red background), one can increase the gas rate (column "Gas Rate") of the valve above to reduce its production pressure (transfer pressure) and thus reduce the unloading pressure at the current valve depth.
- Verify that, when injecting through a given valve, all IPO valves above it are closed.
- There should be a positive pressure differential through the valve when injecting (at selected valve row, column "piod" > column "pprod").
- In the valve table, determine the appropriate valve port size to give the desired user-input gas rate (columns "Gas Rate" and "Calc. Gas Rate" should have similar values; if not, the "Calc. Gas Rate" column will have a red background). For the selected valve model, try different port sizes to achieve this. It is often not possible to achieve the user-input gas rate exactly; in that case, the user can change the user-input value (increase or decrease). Be aware that decreasing it usually increases the unloading pressure of the valve below, so one should check step 4a again.
- In the valve table, check the column "Casing Heading" for "true". If "true", try increasing the gas rate through the valve.
-
Export your valve table and send it to the provider or workshop.
IPO Valve Model
When the IPO valve model is different from "Other", valve flow calculations are performed using the Winkler model. The Winkler model accounts for valve "throttling", where a high pressure differential across the valve can give a rate reduction (or even close the valve).
The IPO valve position depends on the pressures applied to the valve surfaces. The bellows pressure (pbt in the figure below) acts to close the valve, while the injection pressure at depth and the production pressure (piod and pt in the figure below) act to keep it open.
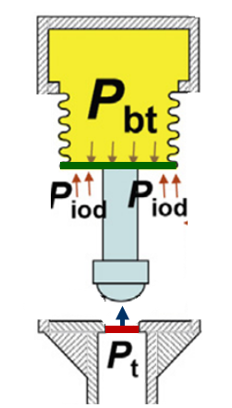
When the production pressure is very low, the bellows pressure tends to move the valve stem closer to the seat, effectively creating a restriction and reducing the flow.
The figure below (generated using SNAP) shows the calculated gas flow through the valve (y axis) as a function of the production pressure (downstream pressure, x axis), keeping the injection pressure (upstream pressure) constant. Gas flow is calculated for three models: Thornhill-Craver, Winkler and VPC. Winkler and VPC predict "throttling" (valve flow reduces when production pressure is too low).
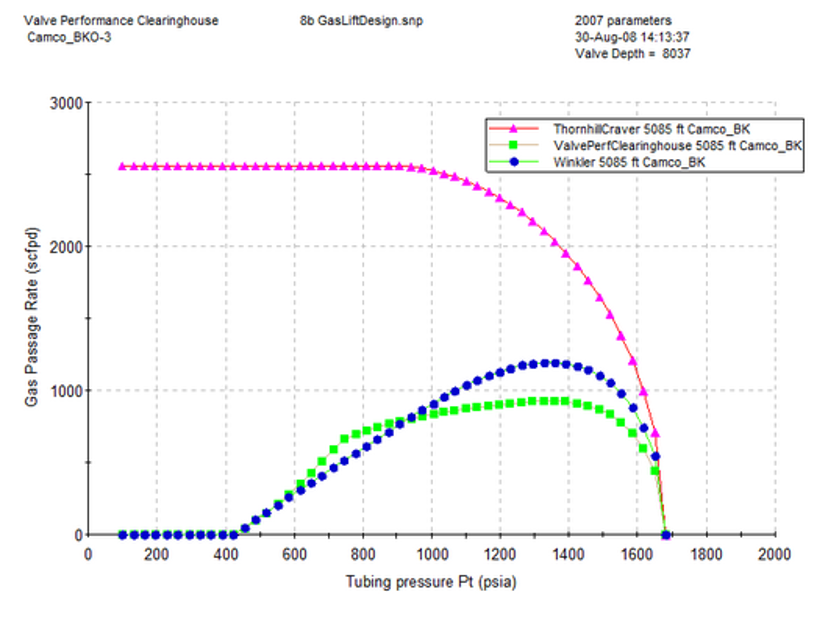
Workarounds to throttling are: 1) choose a valve with a bigger port, 2) use a choke (using a choke will increase the pressure at the port, effectively keeping the valve open [2]).
4. Gas Lift Design Equations and Theory
The key nomenclature used throughout the module and equations in this section are specified in the table below.
| Symbol | Description | Units |
|---|---|---|
| T | Valve / gas temperature | °F |
| Ct | Bellows temperature-correction factor | dimensionless |
| R | Valve area ratio | dimensionless |
| piod | Injection opening pressure at valve depth | psia |
| pprod | Production pressure at valve depth | psia |
| ptro60 | Test-rack opening pressure referenced to 60 °F | psia |
| pupstream | Generic upstream pressure | psia |
| pdownstream | Generic downstream pressure | psia |
| pbellows | Bellows pressure at valve temperature | psia |
| pbellows,60 | Bellows pressure referenced to 60 °F | psia |
| pm | Intermediate pressure between valve and choke | psia |
| q | Gas flow rate | Mscf/d |
| qg,inj | Injected gas rate | Mscf/d |
| γg | Gas specific gravity relative to air | dimensionless |
| z | Gas compressibility factor | dimensionless |
| k | Specific-heat-capacity ratio, Cp/Cv | dimensionless |
| d | Port/orifice/choke diameter | in |
| Af | Effective valve flow area | in2 |
| Ap | Port flow area | in2 |
All pressures in this procedure are expressed as absolute pressures (psia). Traditional gas-lift literature commonly reports test-rack and valve-setting pressures in psig; atmospheric pressure is therefore included explicitly here where required.
4.1 General Equations
The equations below are shared by the valve, orifice, and choke flow models.
The specific heat capacity ratio is calculated from gas specific gravity as:
The actual pressure ratio across a restriction is:
and the critical pressure ratio is:
Flow through the restriction is critical when:
This condition is reported in the "Critical Flow in Valve" column of the valve table. Once the flow is critical, lowering the downstream pressure further does not increase the gas rate, so the flow equations use the pressure ratio limited to the critical value:
The pressure-ratio term that appears in both the Thornhill-Craver and Winkler equations is:
The gas compressibility factor is evaluated at the upstream pressure and the gas temperature:
Port size specified in 1/64 in are:
and the corresponding flow area is:
4.2 Temperature Correction
The IPO valve bellows are charged with nitrogen, whose pressure changes with temperature. The valve is set on the test rack at 60 °F but will operate at the temperature of the valve depth. Therefore, we must correct the bellow pressure between the two conditions. The temperature-correction factor for a nitrogen-charged bellows, neglecting the effect of silicone oil, is:
with in T in °F. The bellows pressure at 60 °F is then:
Since at 60 °F and decreases as temperature increases, a valve operating at a downhole temperature above 60 °F has a higher bellows pressure than it had on the test rack.
4.3 Valve Force Balance — IPO
The IPO valve pressure force balance is (at static conditions):
The valve opens when the left-hand side becomes positive, that is, when the opening forces from the injecion and production pressures exceed the closing force from the bellows.
4.4 Test-Rack Opening Pressure
The test rack opening pressure () is the upstream pressure at which an IPO gas lift valve opens during shop or surface calibration at a controlled temperature of 60 °F and with the downstream side discharged to atmospheric pressure. If is known, one can calculate the bellows pressure at 60 °F:
Applying the force balance from Section 4.3, we get:
The bellows pressure at valve temperature can be found by applying the temperature correction from Section 4.2:
The value of is usually found by applying pressures upstream and downstream the valve when the valve is supposed to open and then:
- Back-calculate the required bellows pressure to ensure valve is open.
- Convert bellows pressure to a temperature of 60 °F.
- Ultimately calculate .
The procedure uses the two equations shown above.
Consider that the surface injection pressure is the surface operating gas injection pressure to open the valve and the production pressure is . Then the surface opening injection pressure is converted to opening injection pressure at depth using the following equation (neglecting friction losses in the injection conduit) is given by:
Then the force balance in the valve gives:
The pressure is also known as closing valve pressure at depth and is is typically converted to surface (and reported) using
Test rack opening pressure at 60 °F of a valve is typically calculated by substituting and in the equation above and using:
and substituted back into the test rack force balance to give the test rack opening pressure:
4.5 Thornhill-Craver Orifice / Choke Gas Rate
The Thornhill-Craver equation is used to calculate the gas rate for orifices, chokes, and IPR valves for model "Other". The Thornhill-Craver gas rate, in Mscf/d is given by:
Where
and
and
4.6 Winkler Gas Rate — No Choke
The Winkler model is used for IPR valves of all models other than "Other". The effective flow area is the smaller of the port area and the opening between the ball and seat.
where is the port area and is the area of the opening between a centered ball and sharp-edged seat. The stem position used to calculate is estimated using using SNAP's method, that consists of a quasi-static force-balance approximation for stem travel.
Then
and the Winkler gas rate, in Mscf/d, is:
where 0.96 is the discharge coefficient, .
4.7 IPO Valve With Downstream Choke
When an IPO valve has a downstream choke, the gas flows through two flow restrictions in series: firstly the valve port, then the choke. This means that the valve pressures are evaluated sequentially from (upstream), to an intermediate pressure , and the choke from to . Since both restrictions have the same gas rate, is the the intermediate pressure that makes the two rates equal.
The valve is evaluated from to , while the choke is evaluated from to . Therefore, we define the residual as:
within the interval:
4.8 Wim der Kinderen / Dick ter Avest Casing-Heading Stability Test
Casing heading is an instability in which the injection pressure, the gas injection rate, and the production pressure oscillate instead of settling at a steady operating point. The gas lift design module screens for casing heading by using the stability criteria of the Wim der Kinderen / Dick ter Avest.
The operating point is stable when the production pressure at valve depth does not decrease as the injection rate increases:
If instead
the operating point is unstable if either:
or
with
Otherwise, the operating point is stable.
Advanced Temperature Option
Temperature has a non-negligible effect on the gas lift design calculations, particularly on the estimation of bellows pressures and ptro,60, among others (IPO valves are charged with nitrogen and nitrogen will expand differently at different temperatures).
The temperature-depth profiles in the gas lift design module are estimated assuming a constant wellhead temperature and using the values user-input in the bottomhole pressure module (see screenshot below).
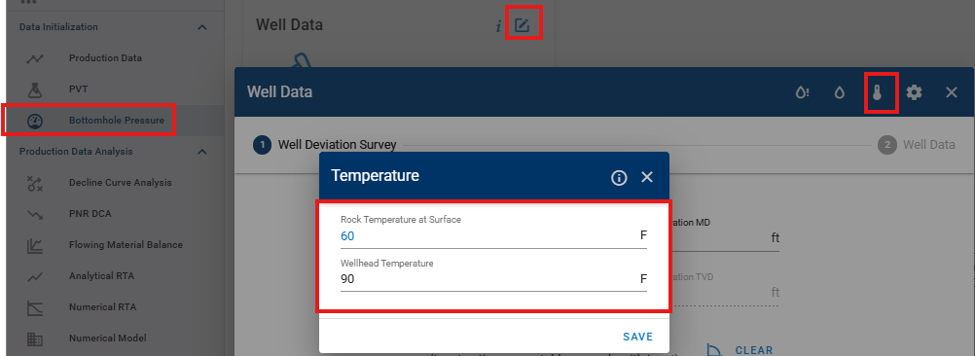
These values are used to estimate an overall wellbore heat transfer coefficient, and that value is then used to find temperature at a given depth.
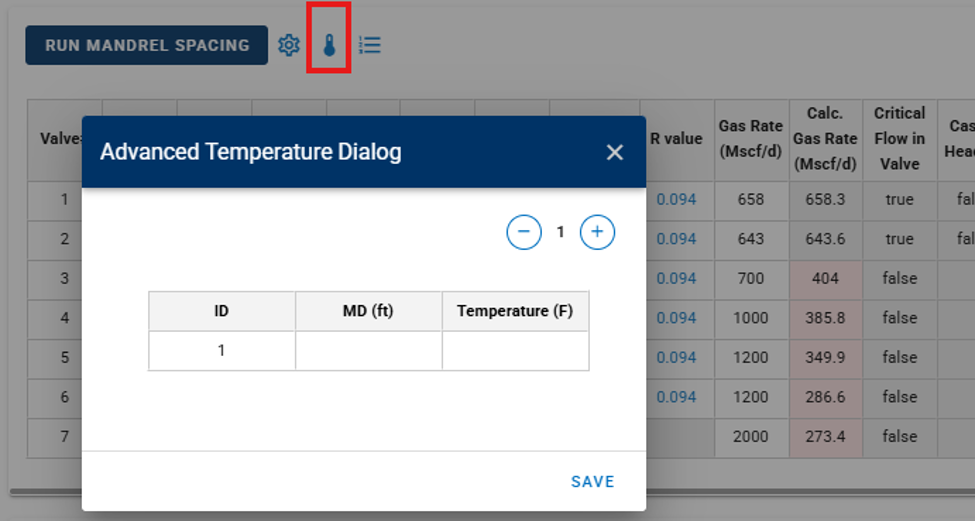
However, during unloading, when reservoir inflow is low or non-existent, wellbore temperatures may be much colder than when the well is operating at full gas lift injection rate. For those situations, the user can input a custom temperature distribution (see screenshot below) when injecting through each valve. The temperatures at each valve depth will be interpolated using that distribution. Be aware that the input temperature distribution must exist from wellhead to reservoir depth.
Demo / Video Tutorial of the GLD Module in whitson+
The following video shows a short tutorial of the use of the GLD module in whitson+. We suggest you conduct the same example on your PC.