Results & Export
1. Results Page
The Results page allows you to view calculated attributes and analysis results for multiple wells in a tabular format.
Select the wells you want to compare, then click RESULTS. If no wells are selected, clicking RESULTS displays all wells in the project.
From the results page, you can:
- Use the collapsible and expandable column tree to navigate the available attributes and results.
- Display only the selected wells or all wells in the project.
- Save the current table layout as a template and apply a previously saved table template.
- Filter wells directly from the results table.
- Export the displayed attributes and results to Excel using the one-click EXPORT button.
The results page contains three tabs dedicated to different result categories: Custom, Liquid Loading, and Gas Lift Optimizer.
1.1. Custom
This table shows all the results from the Data Initialization and Production Data Analysis sections, including:
- Production Data
- PVT
- Bottomhole Pressure
- Decline Curve Analysis
- PNR DCA
- Flowing Material Balance
- Analytical RTA
- Numerical RTA
- Numerical Model
- Nodal Analysis
Remember
An analysis must be completed before its results can be displayed in the table.
1.2. Liquid Loading
The Liquid Loading tab displays results related to liquid loading calculations from Main scenario. Users can select a BHP correlation as the basis for calculationg liquid loading table and the calculation is done backwards from the last day of production data.
- Aggregation Type: Mean or Median, providing a smoother representation of the gas rates trends over the selected period.
- Days of Average Calculation: numeric value that specifying the number of days over which to calculate a rolling aggregation for the gas rate.
The available result categories include:
- Gas Rate Information: current gas rate, current gas lift injection rate, and current total gas rate.
- Critical Rate Information: Turner critical rate, Coleman critical rate, Nagoo critical rate, and Belfroid critical rate.
- Erosional Rate: API 14E rate and Svedeman rate.
- Liquid Loading Rate vs. Current Total Gas Rate: Turner, Coleman, Nagoo, and Belfroid.
- Erosional Rate vs. Current Total Gas Rate: API 14E and Svedeman.
- Relative Difference of Current Total Rate and Liquid Loading Rate: Turner %, Coleman %, Nagoo %, and Belfroid %.
- Relative Difference of Current Erosional Rate and Total Gas Rate: API 14E % and Svedeman %.
- Current Liquid Rate Information: Current liquid rate, current oil rate, and current water rate.
1.3. Gas Lift Optimizer
The Gas Lift Optimizer tab displays results related to gas lift optimization from Main scenario that has been performed in the Nodal Analysis module.
The available results include:
- Pressure: casinghead pressure, tubinghead pressure, and correlation.
- Gas Lift: max oil rate, current oil rate, oil rate uplift, oil uplift / gas lift rate change, gas lift at max rate, current gas lift, gas lift rate change, minimum rate to lift, gas lift gradient.
- Liquid Rate: current liquid rate and max liquid rate.
- Gas Rate: current gas rate and max gas rate.
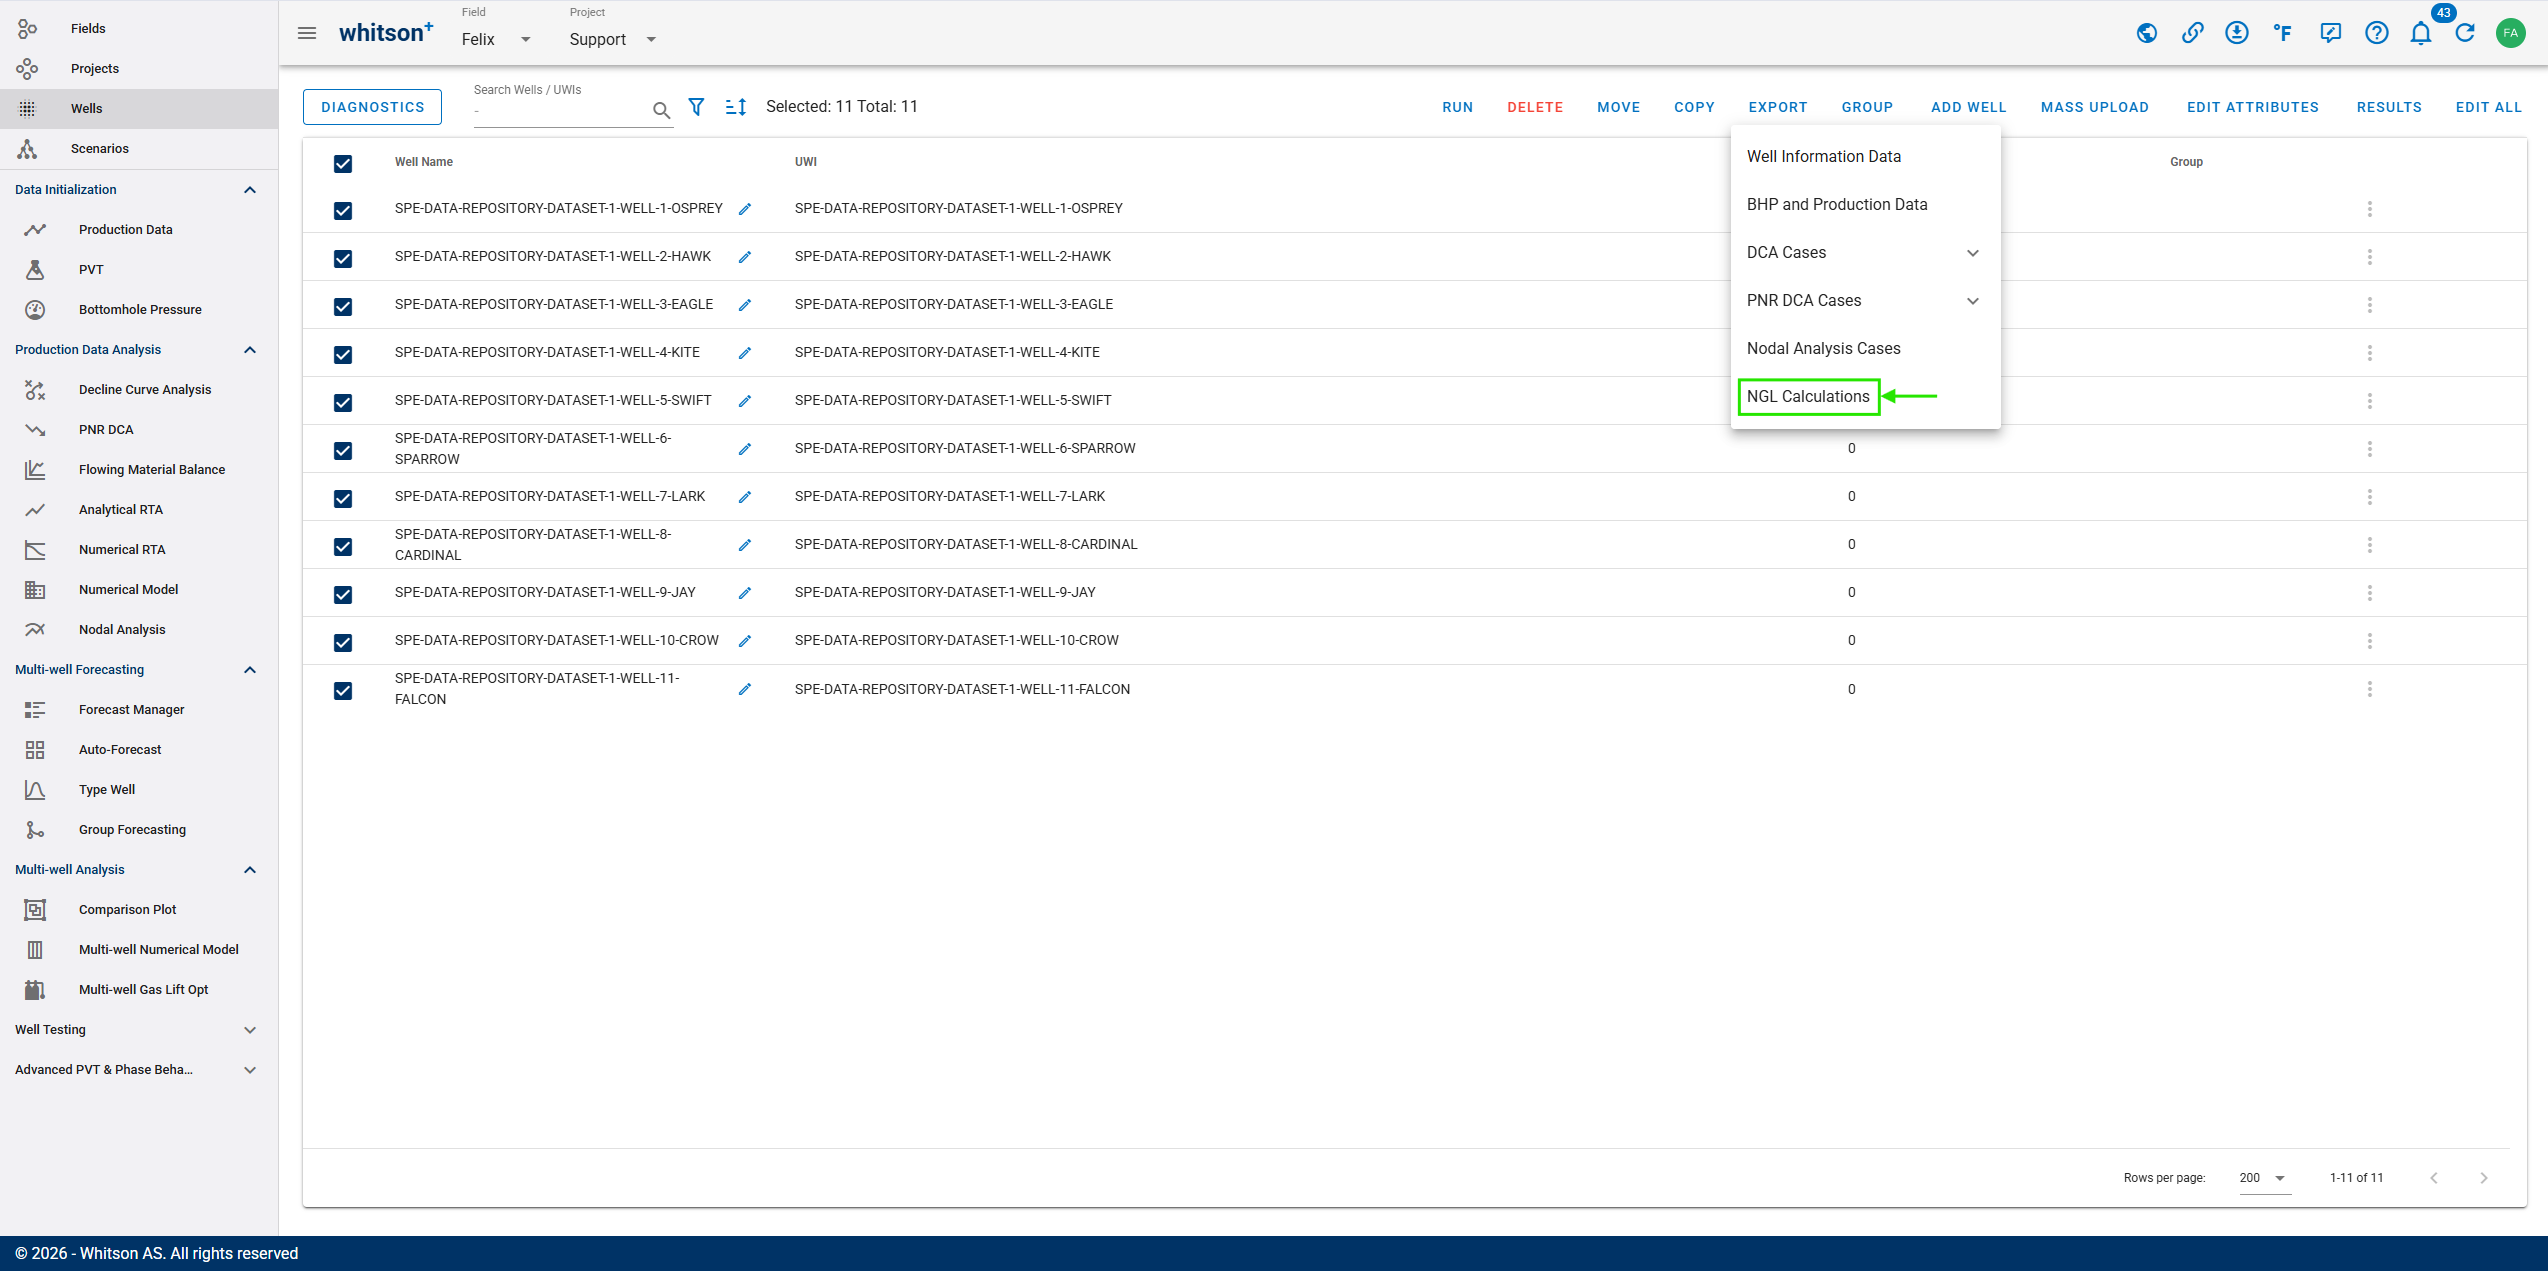
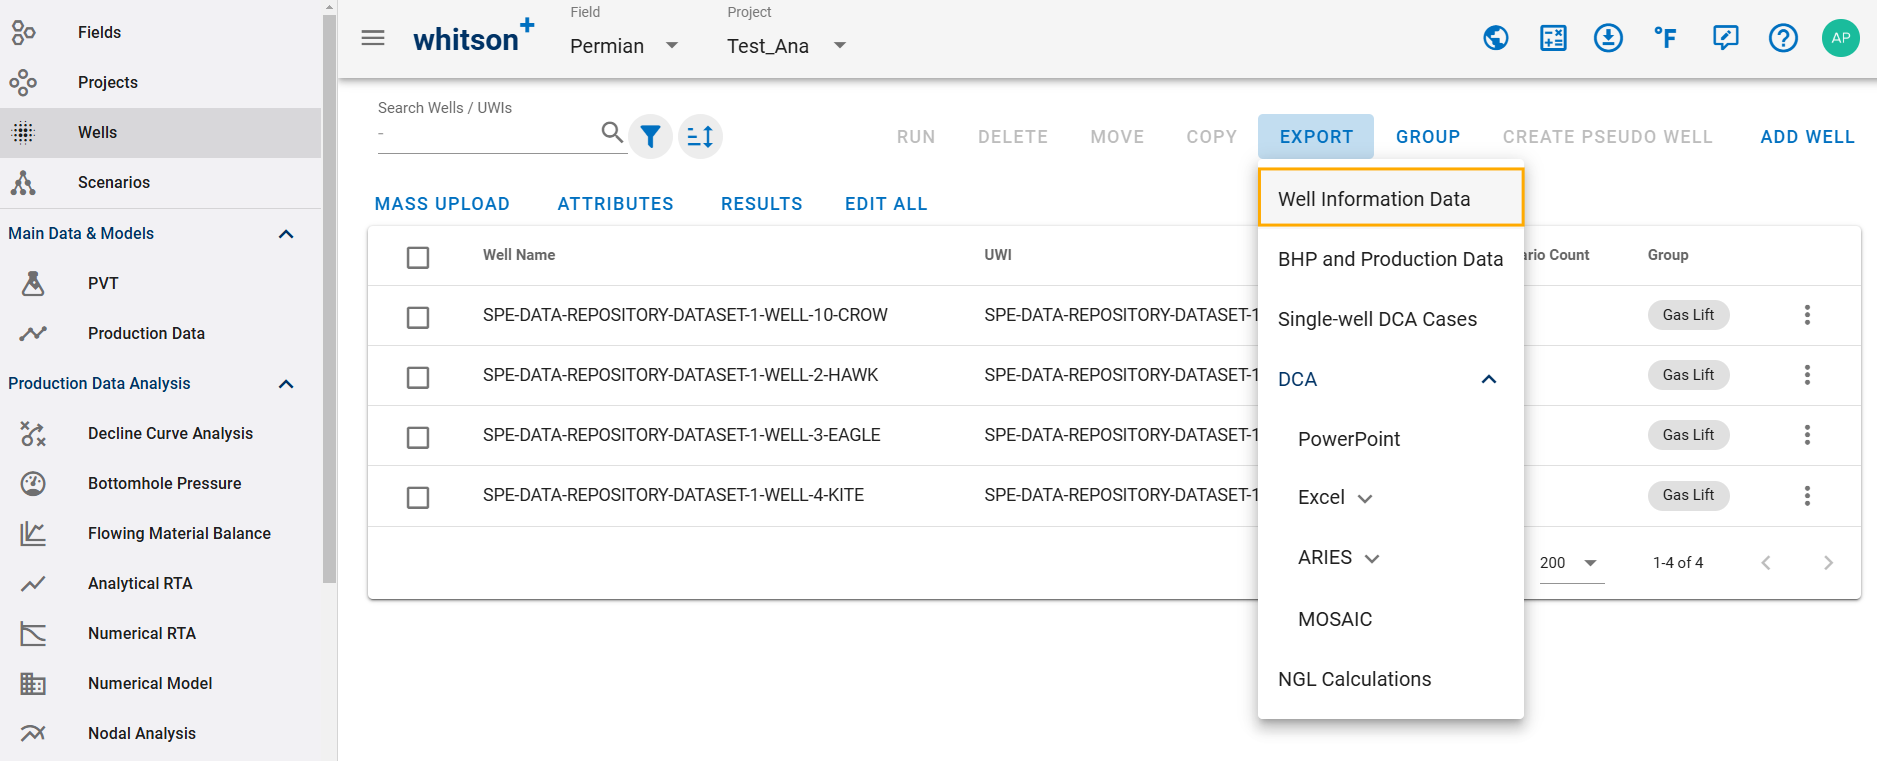
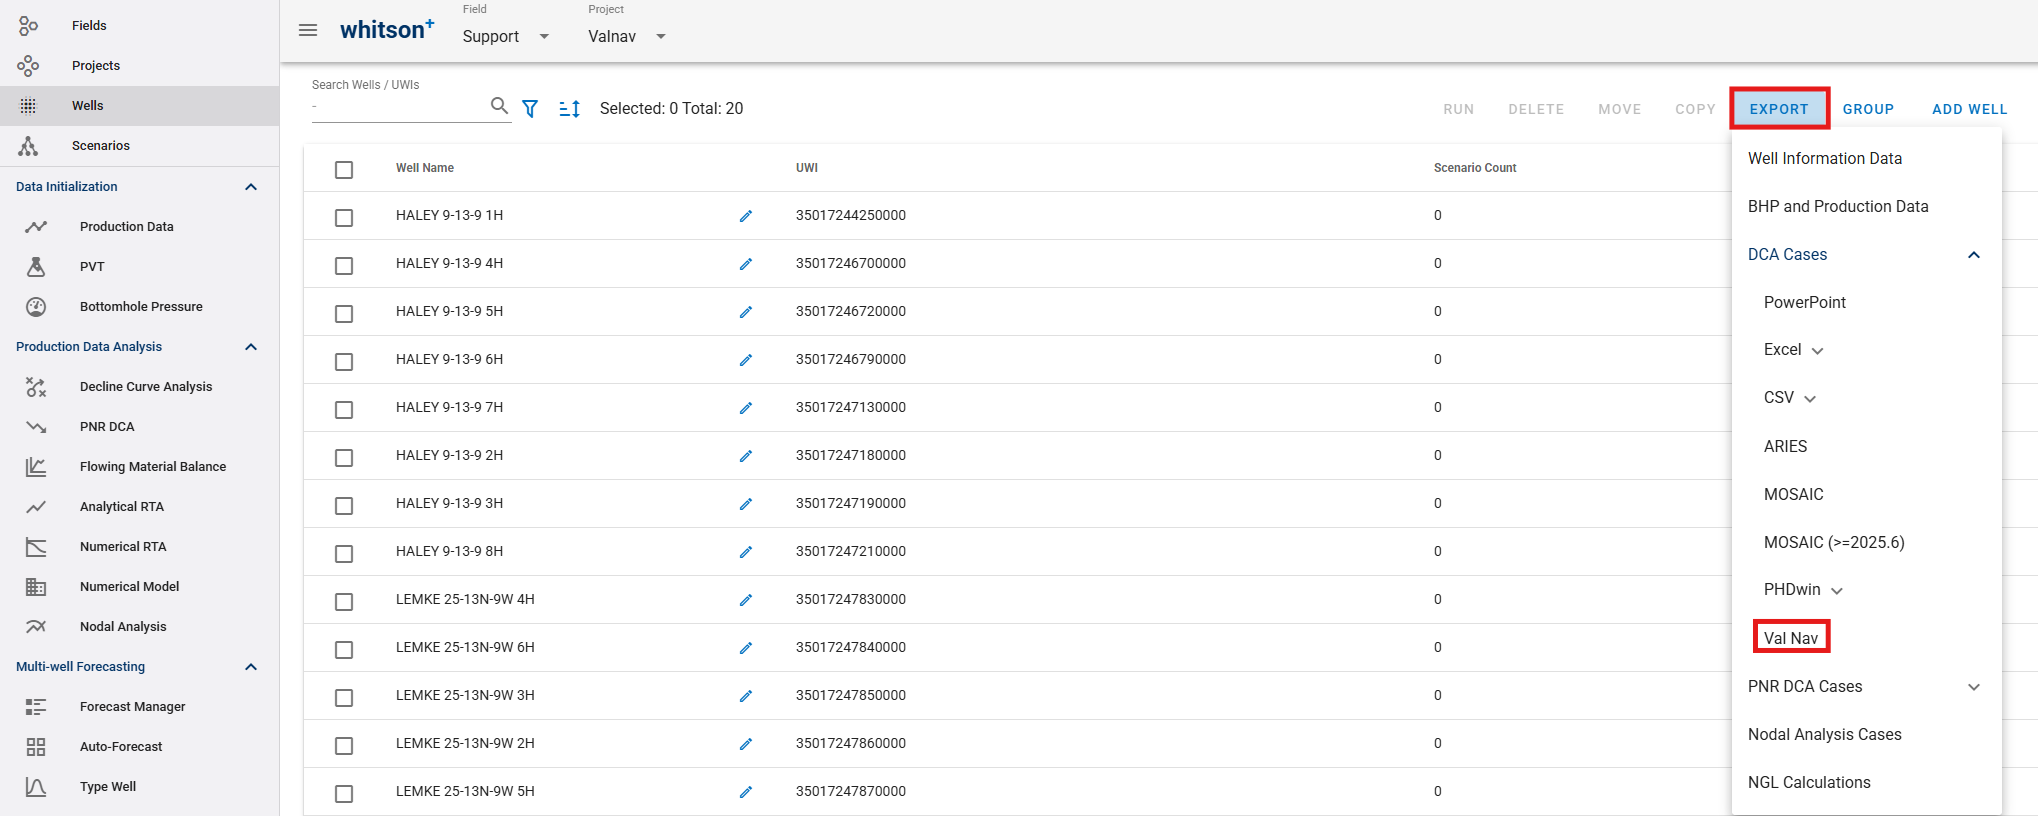
2. Export
The Export option allows you to export well input data and analysis results to Excel or other supported third-party formats.
There are two ways to export data:
-
Export directly from a Results table Export the active columns from the CUSTOM, LIQUID LOADING, or GAS LIFT OPTIMIZER tab by clicking EXPORT on the Results page.
-
Use the main Export menu Export detailed well information, production and BHP data, DCA results, and any other results by selecting the appropriate option from the main EXPORT menu.
Customize the attributes and results included in the export
When exporting directly from a Results table using Option 1, only the active columns in the table are exported. Use the column list panel on the left side of the Results page to select the attributes and results you want to include. Clear the checkbox for any column that should not be included in the export.
2.1. Well Information Data
The Well Information Data option allows you to export well input data and analysis results to Excel for each selected well and its associated scenarios.
The export can include:
- Well Data
- Reservoir Properties
- Completion Metrics
- Decline Curve Analysis
- PNR DCA
- BHP
- BHP Tuning Parameters
- pRi from IPR
- Multiphase Flowing Material Balance
- Recovery Factor Analysis
- Gas Flowing Material Balance
- Classical RTA
- Fractional RTA
- Numerical RTA
- Numerical Model
- Relative Permeability
- Simple Mat Bal
- Fluid Data at Initial Reservoir Conditions
- Surface Gravities
- Production Attributes
- Quality Checks
- Fluid Composition
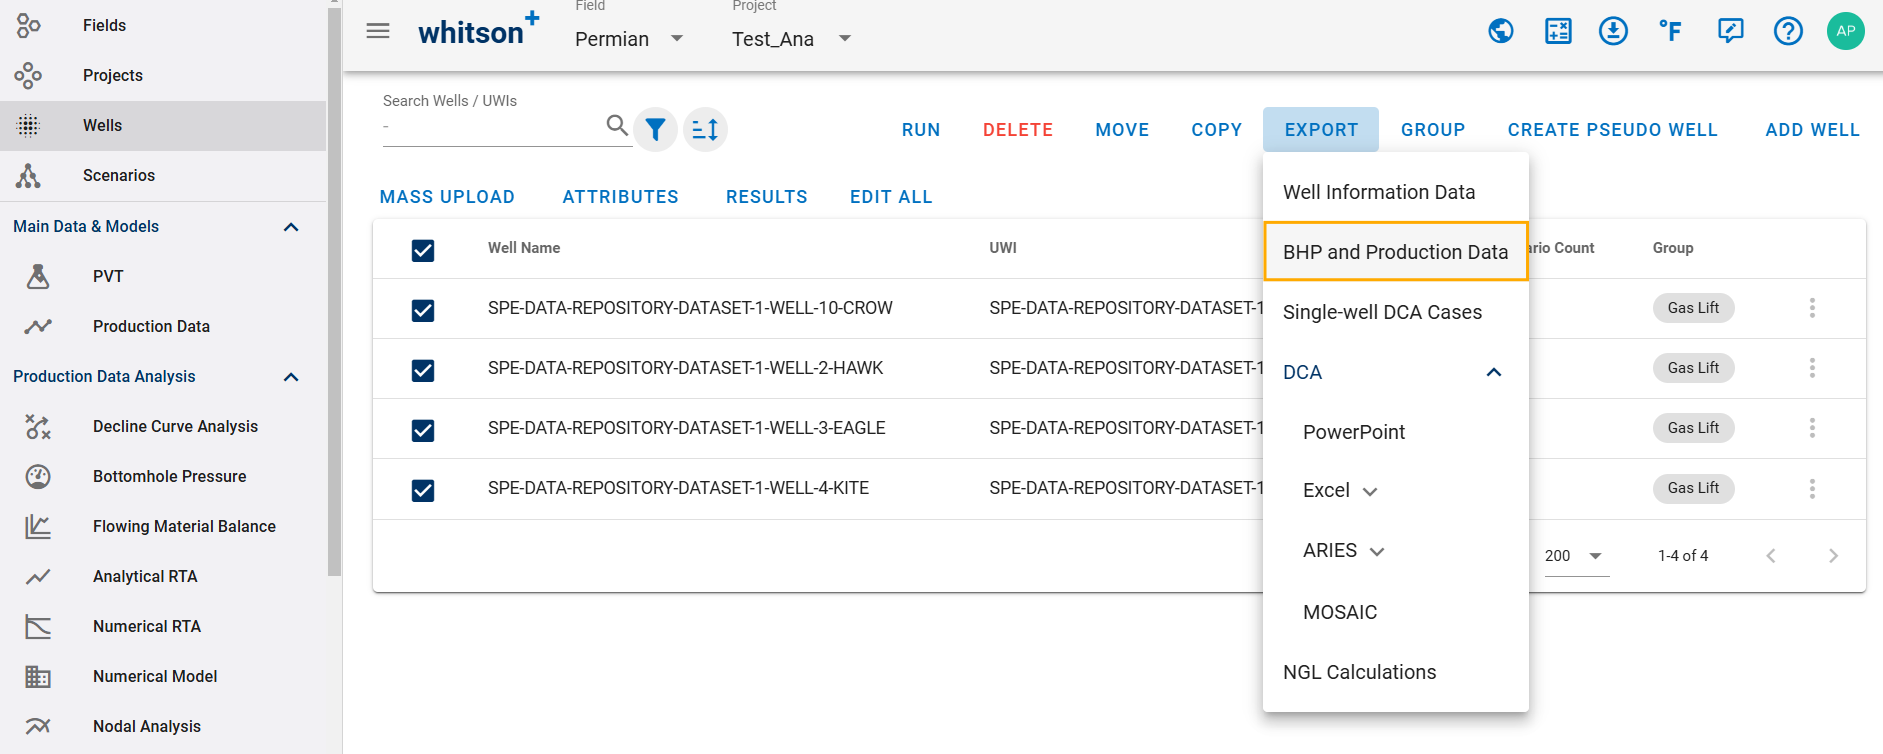
2.2. BHP and Production Data
The BHP and Production Data option allows you to export production data and bottomhole pressure calculation results to Excel.
The export can include:
- BHP results from all correlations
- Production data
- Critical Rate for each BHP correlation
- Multiple scenarios
- Custom range of date interval
2.3. DCA Cases
The DCA Cases option allows you to export Decline Curve Analysis results for the selected saved case.
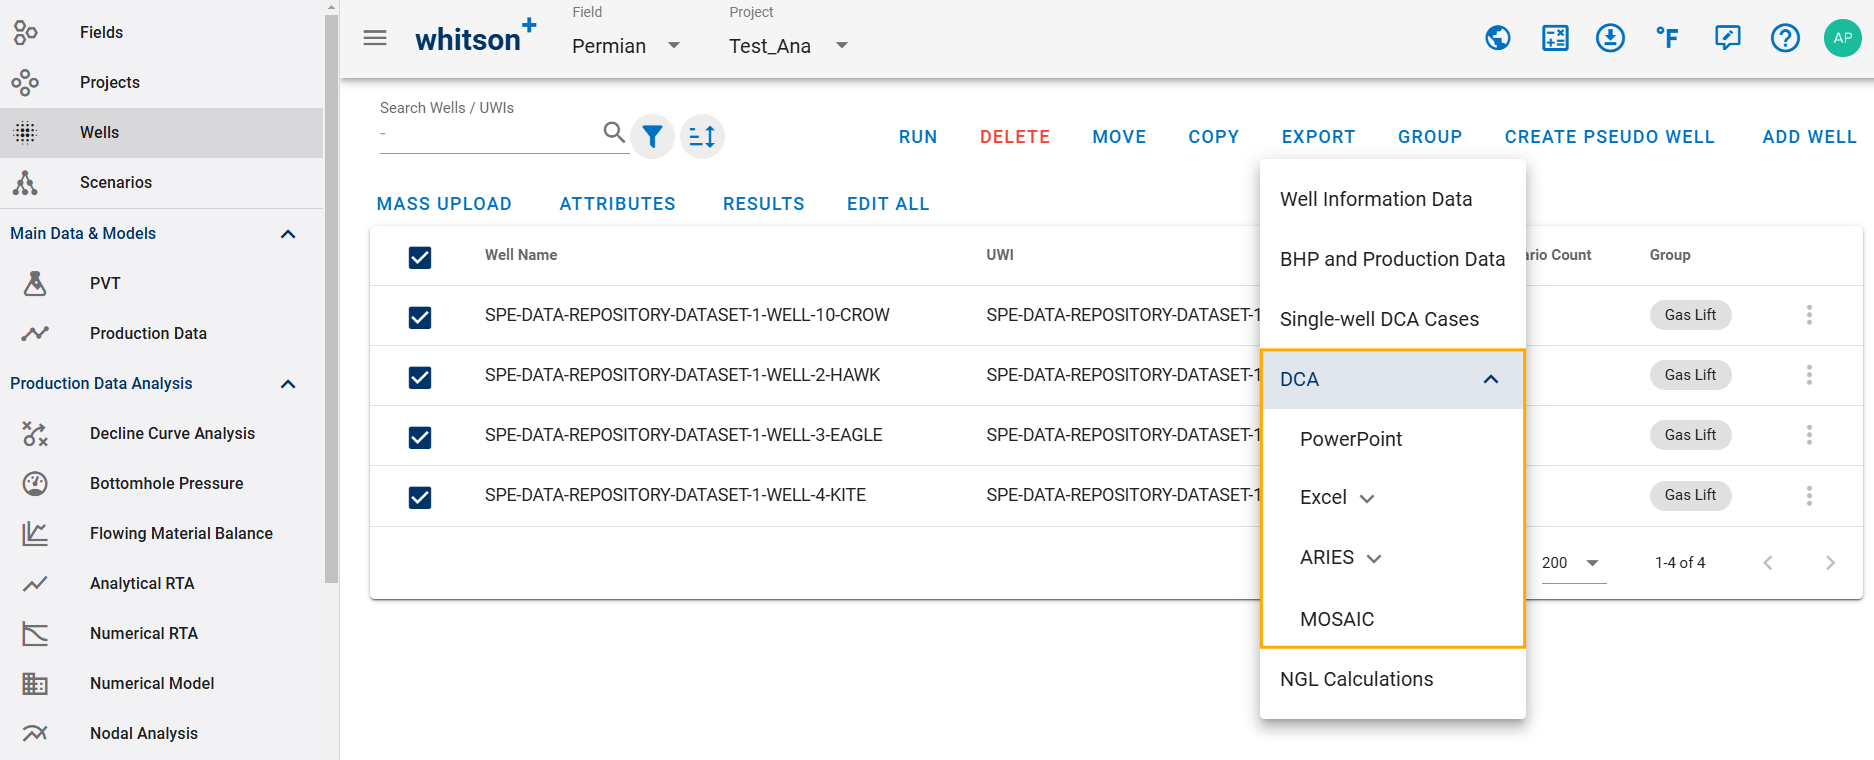
The following export formats are supported:
- Daily Rates
- Monthly Rates
- ARIES
- CSV
- Excel
- MOSAIC
- PHDwin
- Val Nav
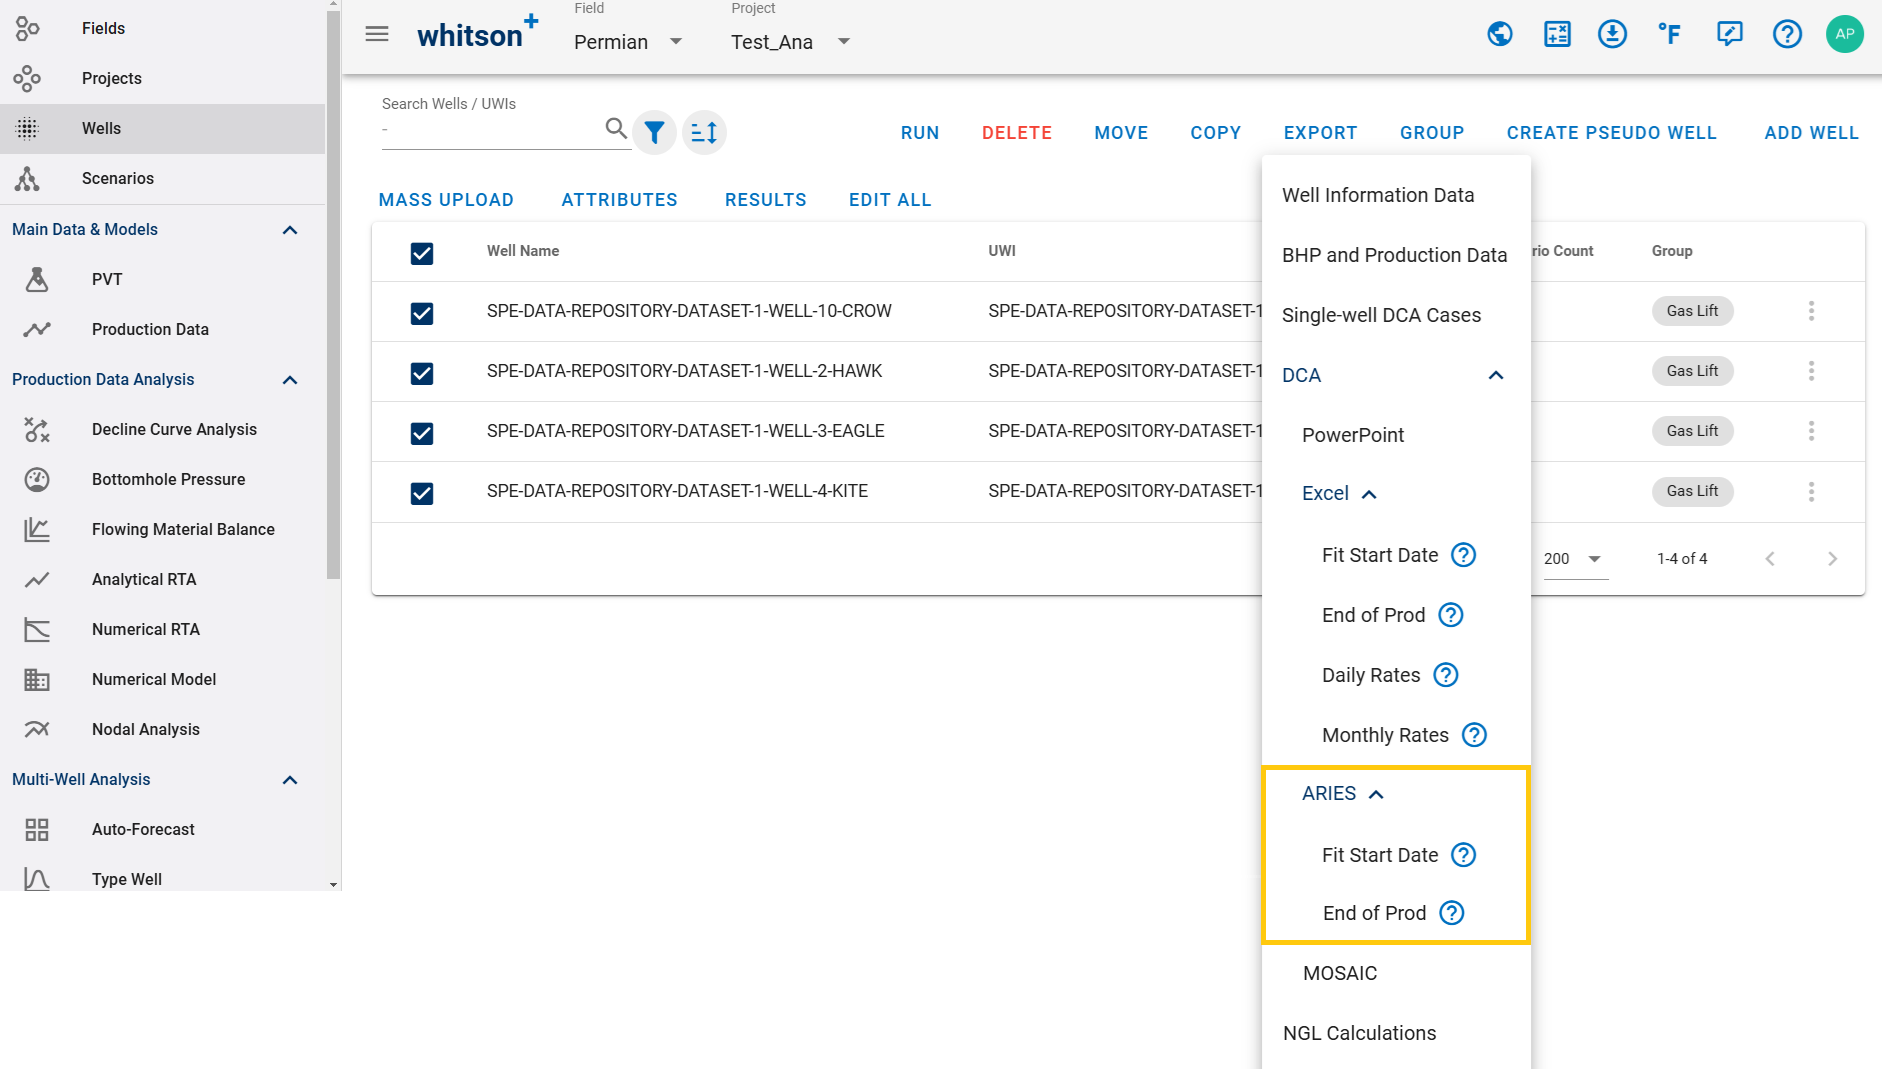
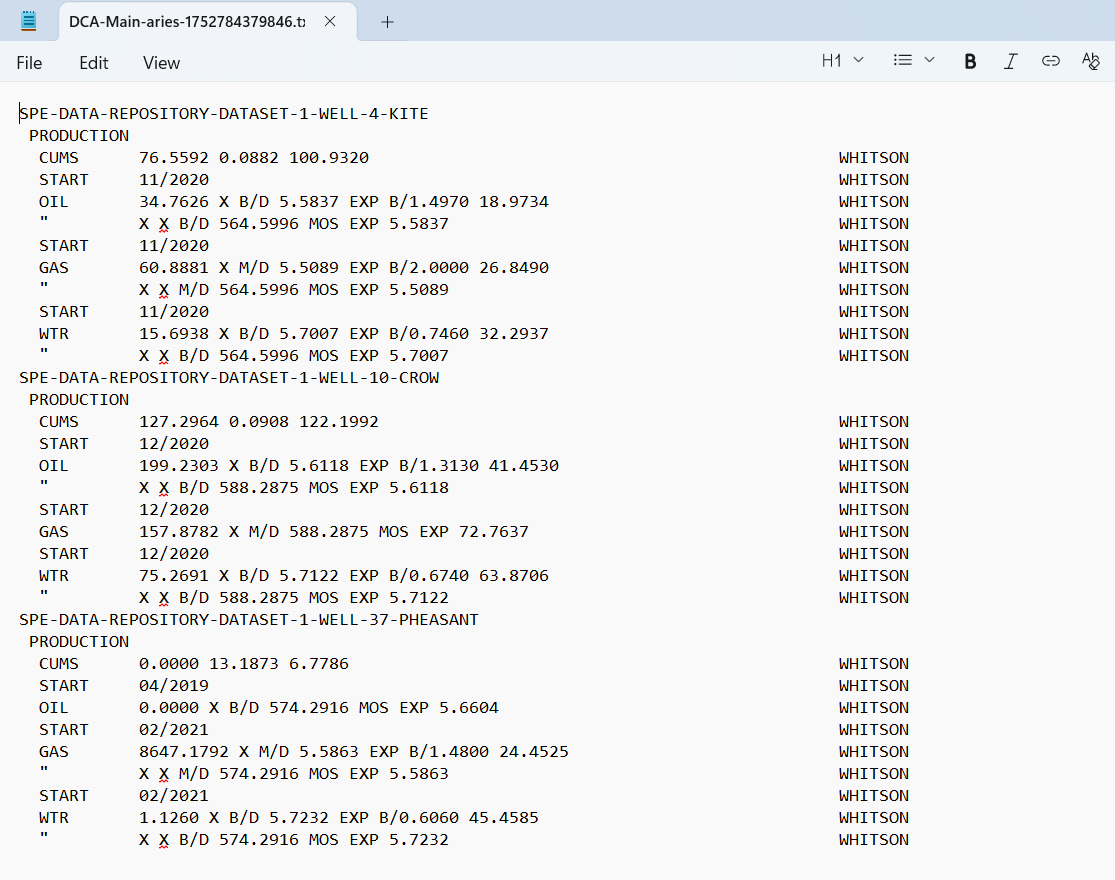
2.3.1. ARIES
You can export DCA results for the selected saved case in ARIES format through the ARIES Export window as follow:
Example ARIES export: DCA-Main-aries.txt
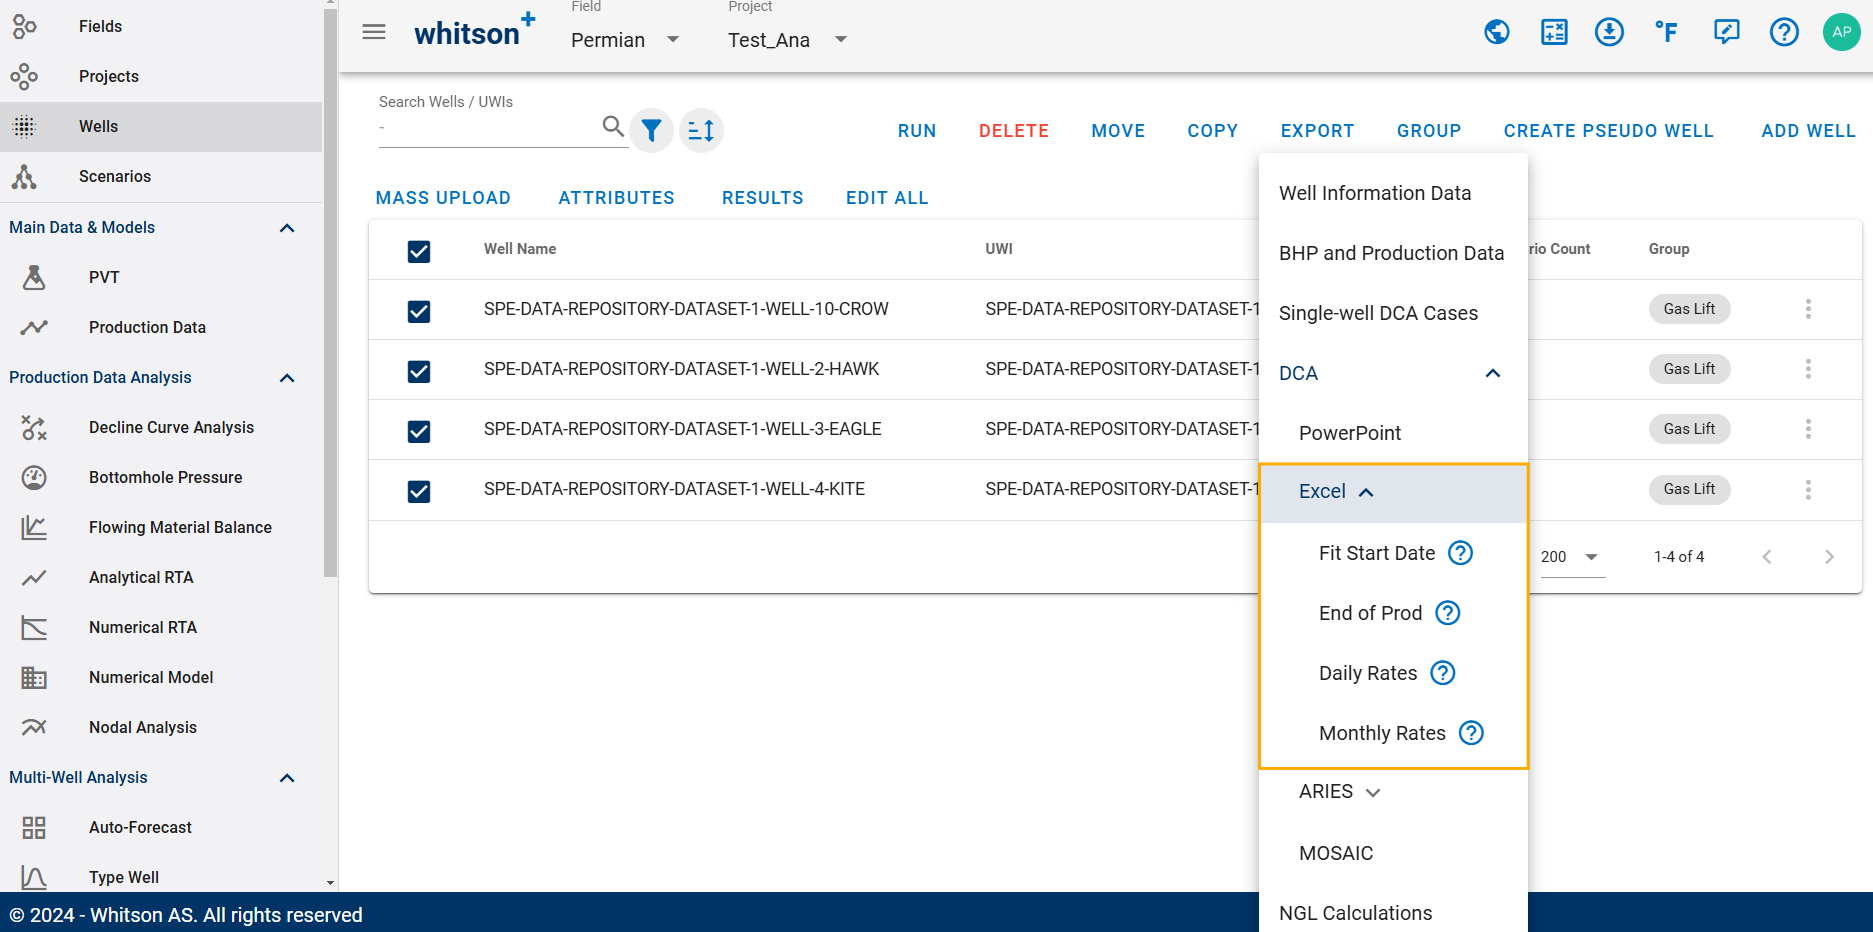
2.3.2. Excel
You can export DCA results for the selected saved case in Excel format using one of the following options:
- Summary Table: exports all DCA cases for the selected wells.
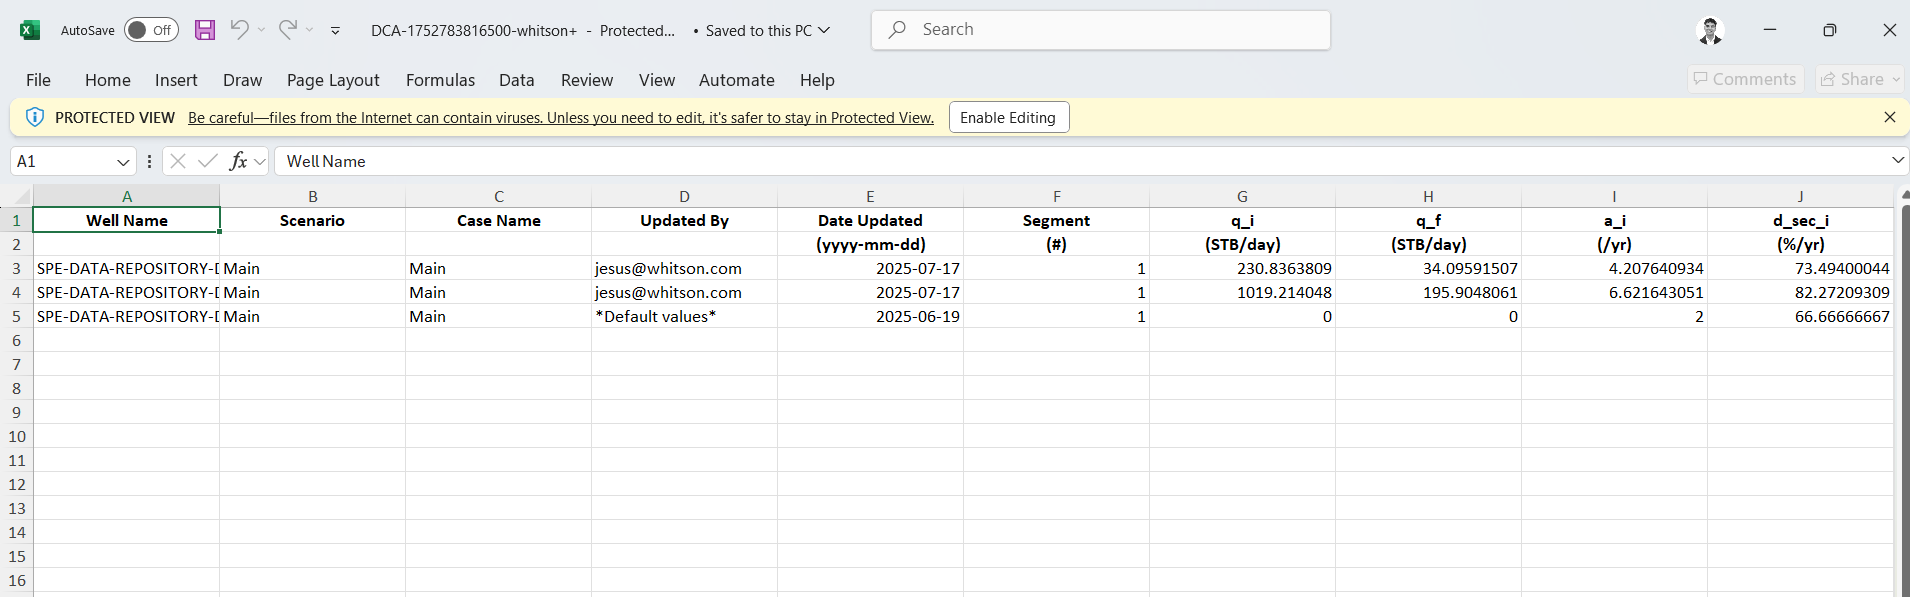
- Fit Start Date: reports the initial flow rate () and initial decline rate () at the fit start date.
- End of Prod: converts and to the end of the production history.
Example DCA summary table: DCA-whitson+.xlsx
2.3.3. MOSAIC
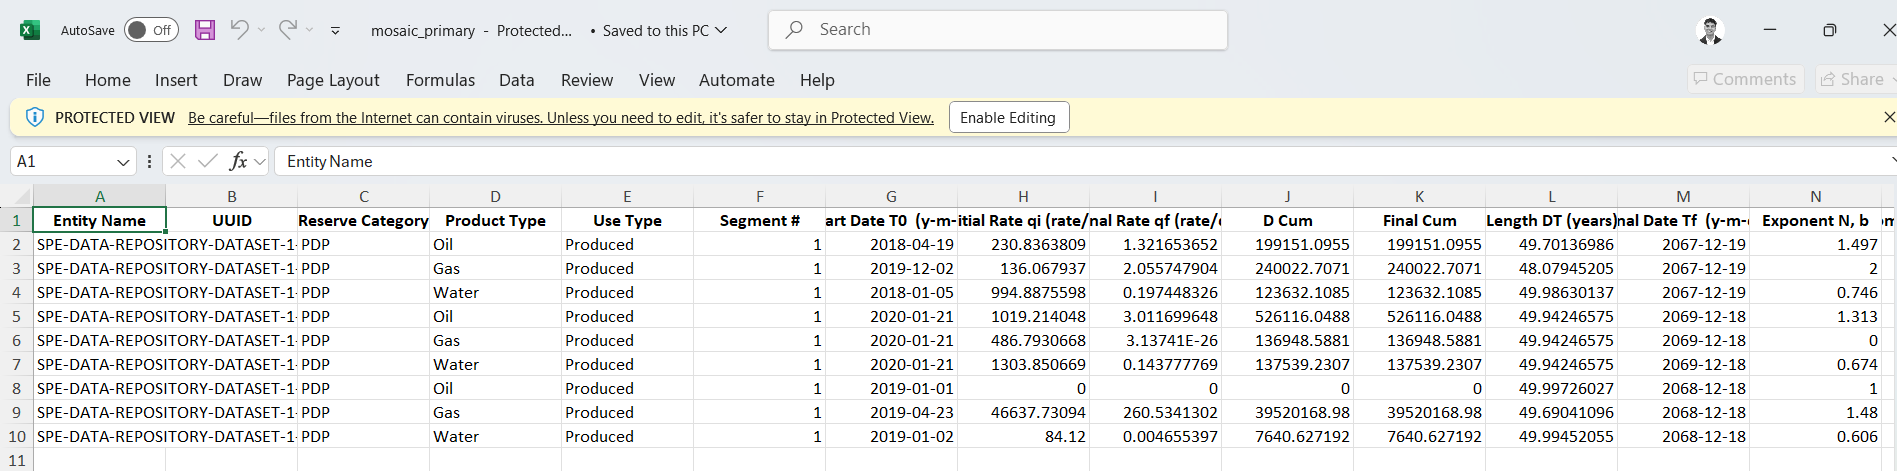
You can export DCA results for the selected saved case in MOSAIC format.
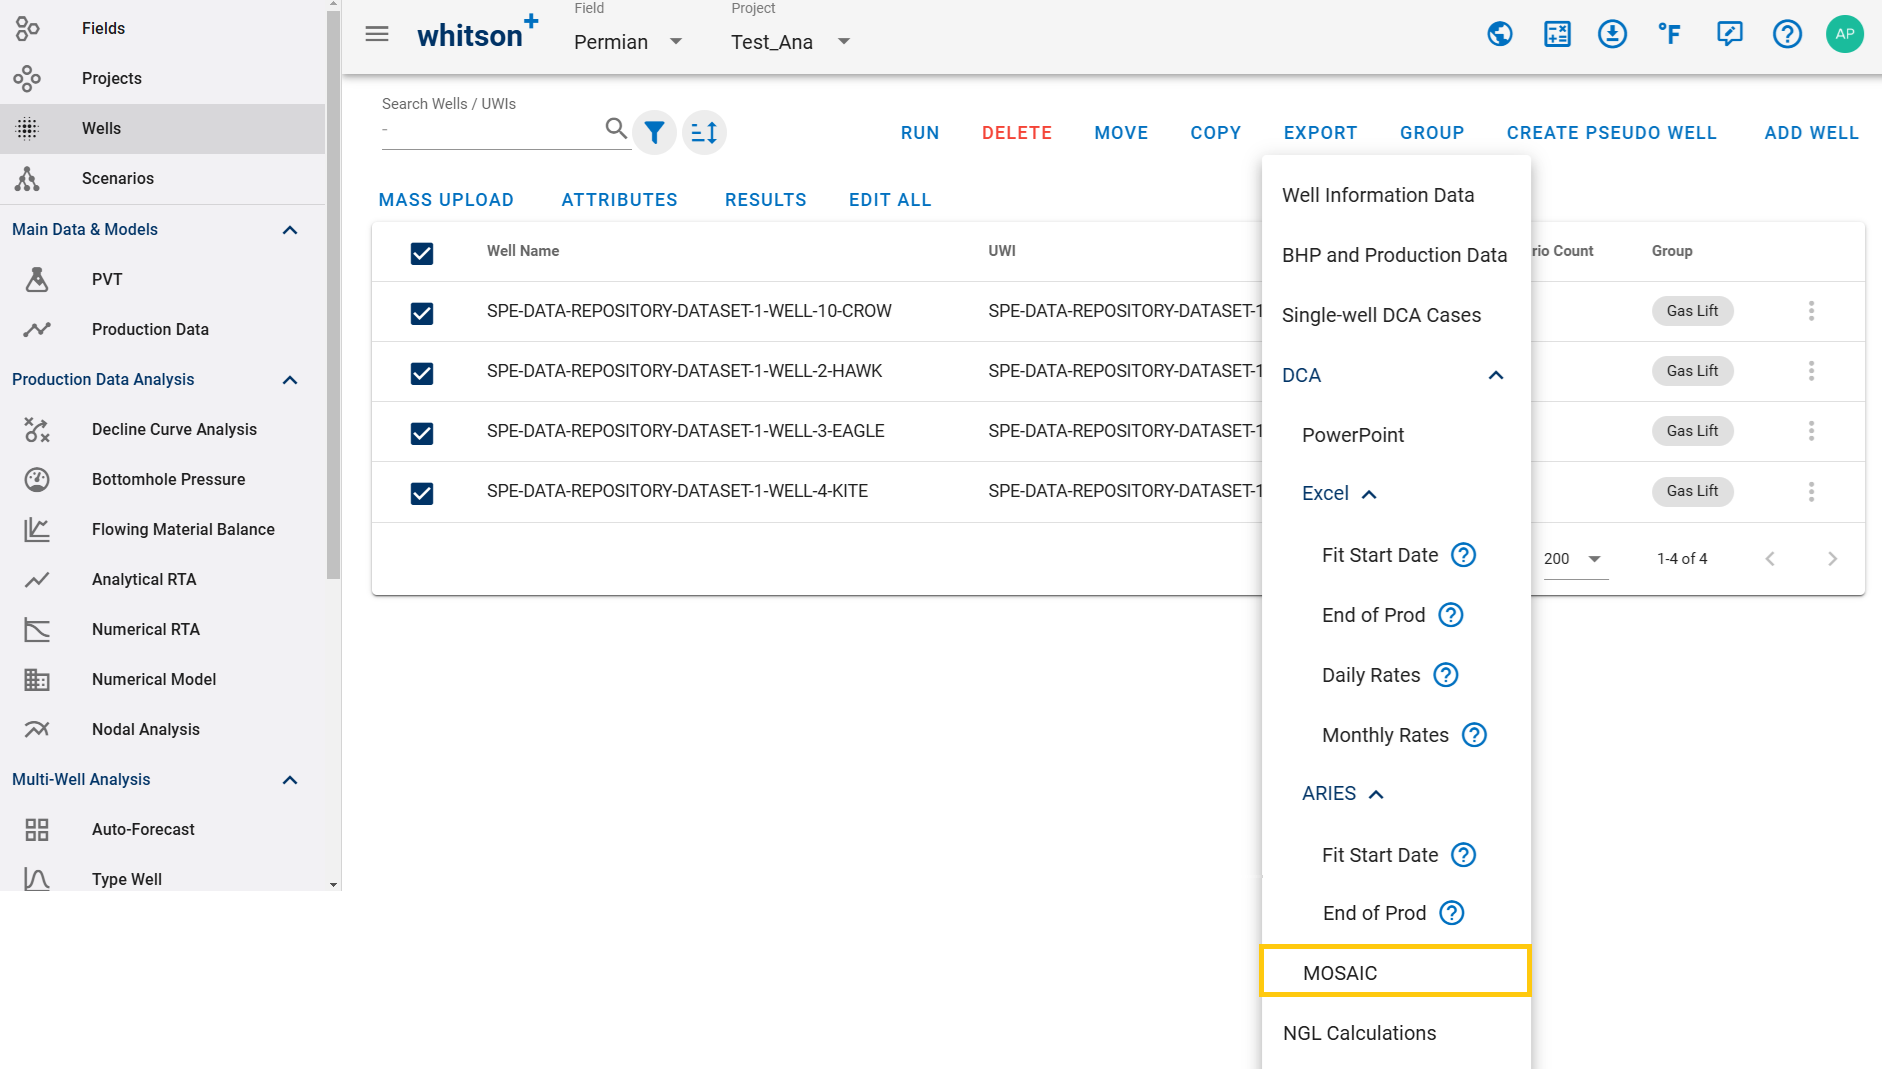
Example MOSAIC export: mosaic_primary.xlsx
2.3.4. PHDwin
You can export DCA results for the selected saved case in PHDwin format through the PHDwin Export window as follow:
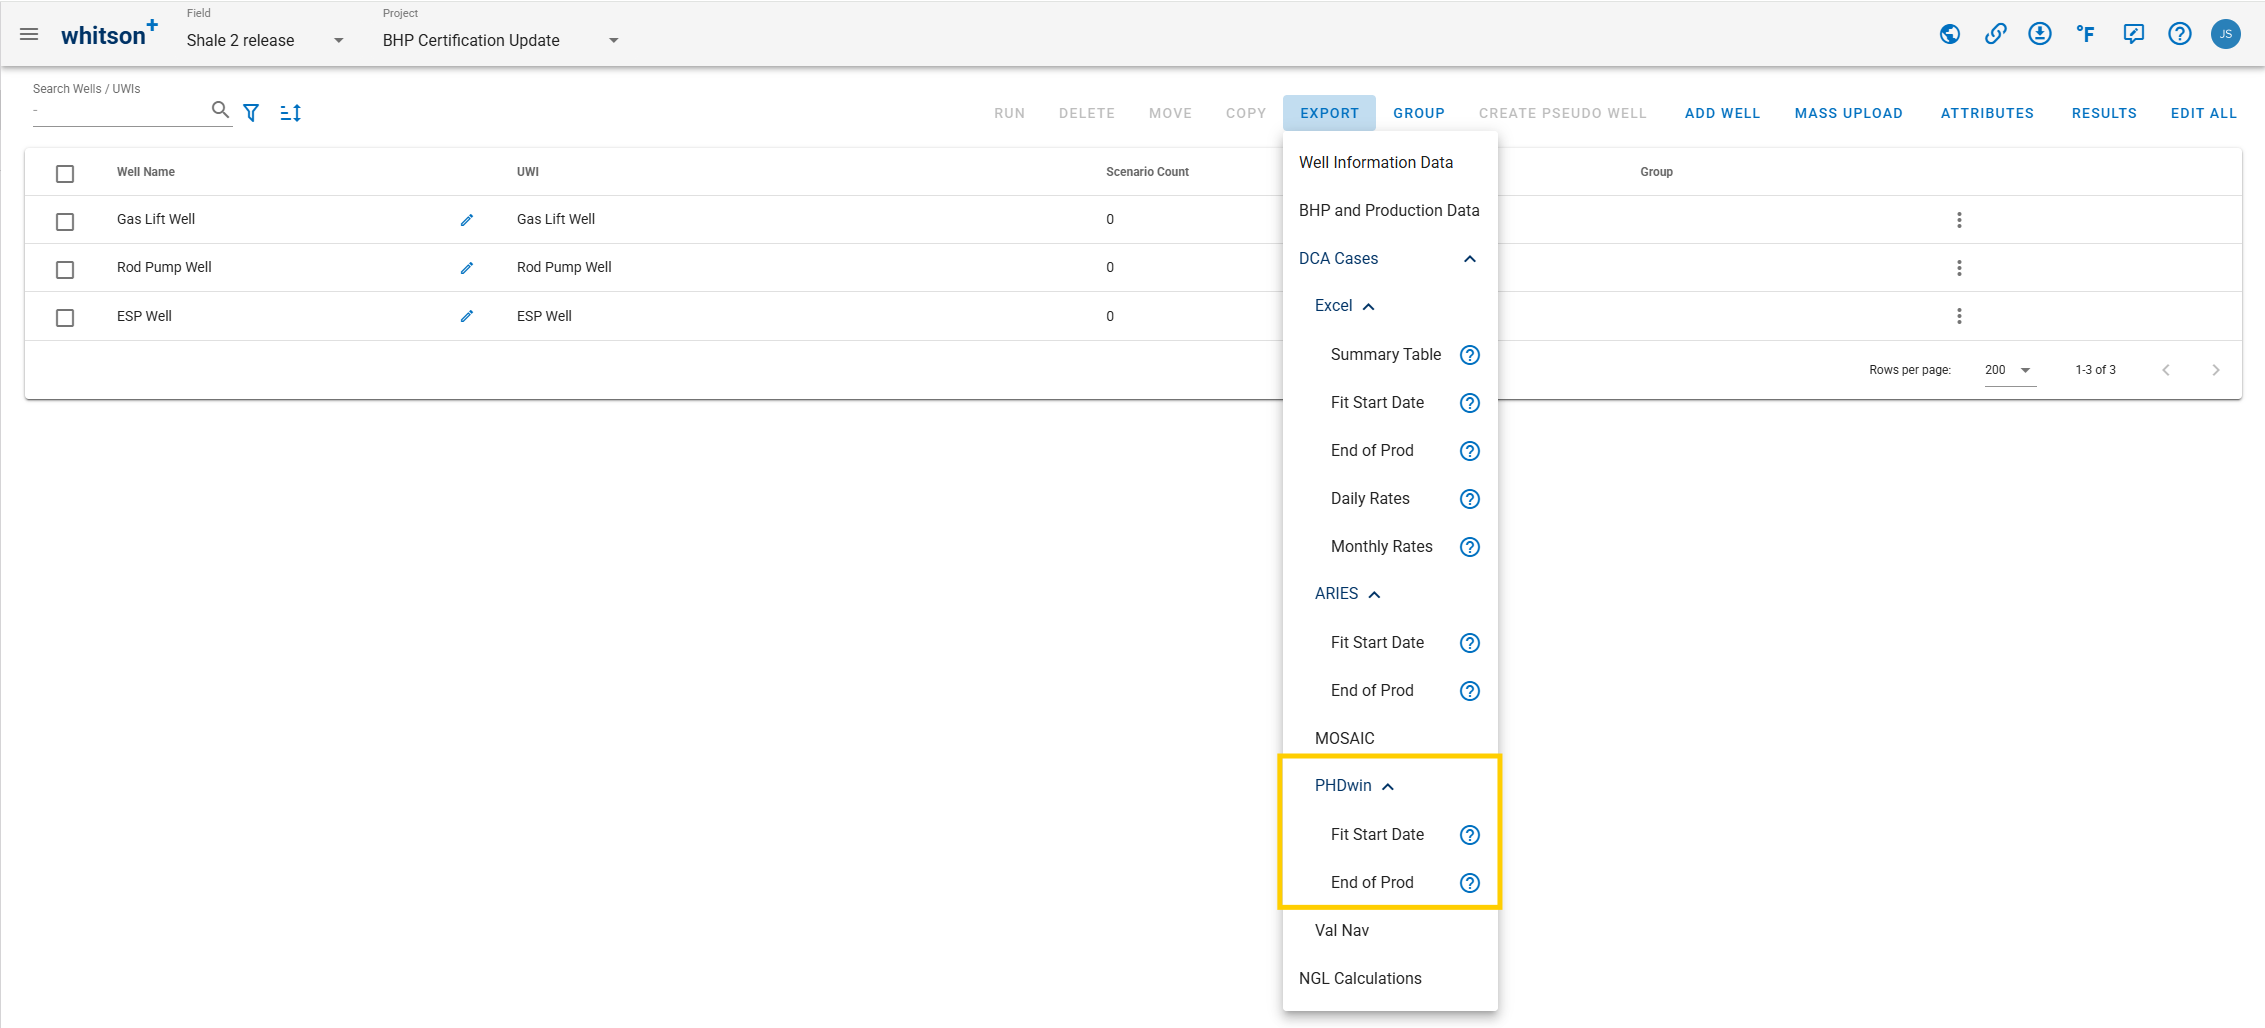
Example PHDwin export: DCA-phdwin.xlsx
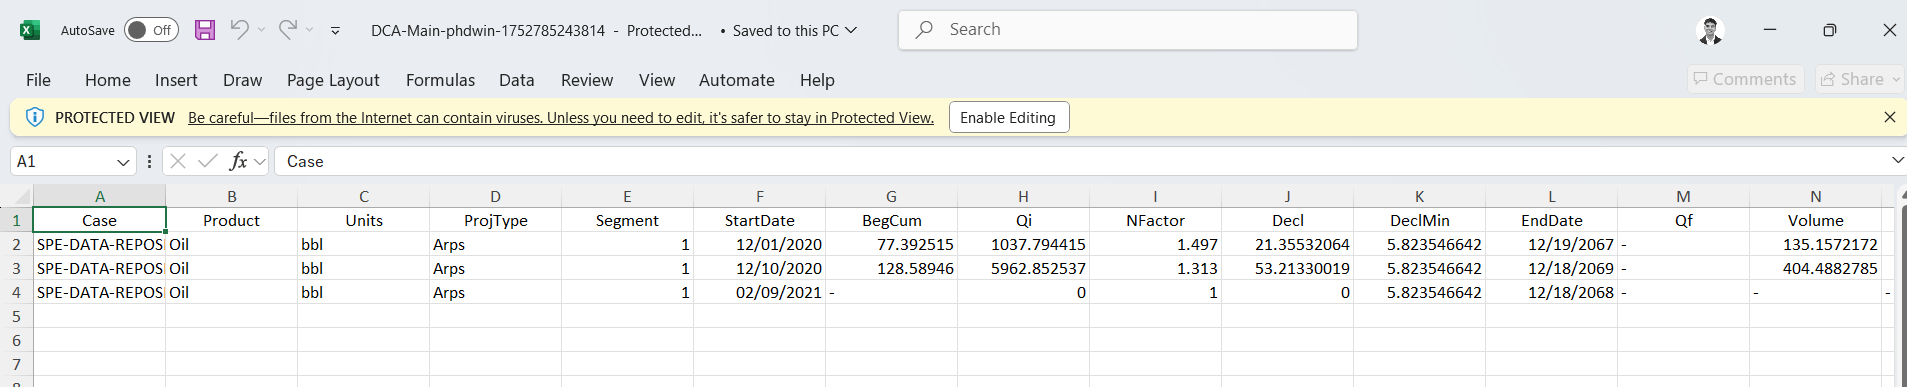
2.3.5. Val Nav
Option to export DCA results excel sheet in Val Nav import format for the selected saved case.
Here's some examples of what the export file from whitson+ would look like:
-
Val Nav Decline Import Template.xlsx
Import Notes Regarding Decline Template:
- Only the columns highlighted in green are required for every record.
- Header names must match the expected field names exactly.
- In each header cell, note the expected units of that field.
- Every product decline segment must include a start date, Qi, and three Arps parameters to be considered valid.
- For the first segment, both start date and Qi are required.
- For the second and later segments, if start date and Qi are left blank, they will automatically link to the previous segment’s end date and Qf.
- For the second and later segments, you can set Di Linked = True to link Di to the Df of the previous segment.
- All segments within the same product decline must be grouped together and sorted in ascending order by segment index (earliest segment first).
- All product declines within the same entity must also be grouped together, though the order of those grouped declines does not matter.
- Decline types for Di and Df (
nominal,effective tangent, oreffective secant) are interpreted according to the user’s active decline-type setting in their user options. - Slope type can be left blank if ratio declines are not being imported.
-
Val Nav Forecast Constants Import Template.xlsx
Import Notes Regarding Forecast Constants Template:
- Only the columns highlighted in green are required for every record.
- Column headers must be matched exactly as written.
- The Second row defines the unit system and available options, so it must also be matched exactly.
2.3.5.1. Importing into Val Nav
Use Spreadsheet Import in Val nav to load decline or forecast-constant data from the whitson+ export template.
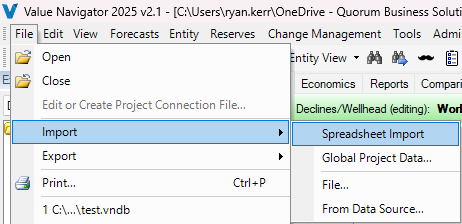
- Go to File > Import > Spreadsheet Import.
- Select the spreadsheet you want to import.
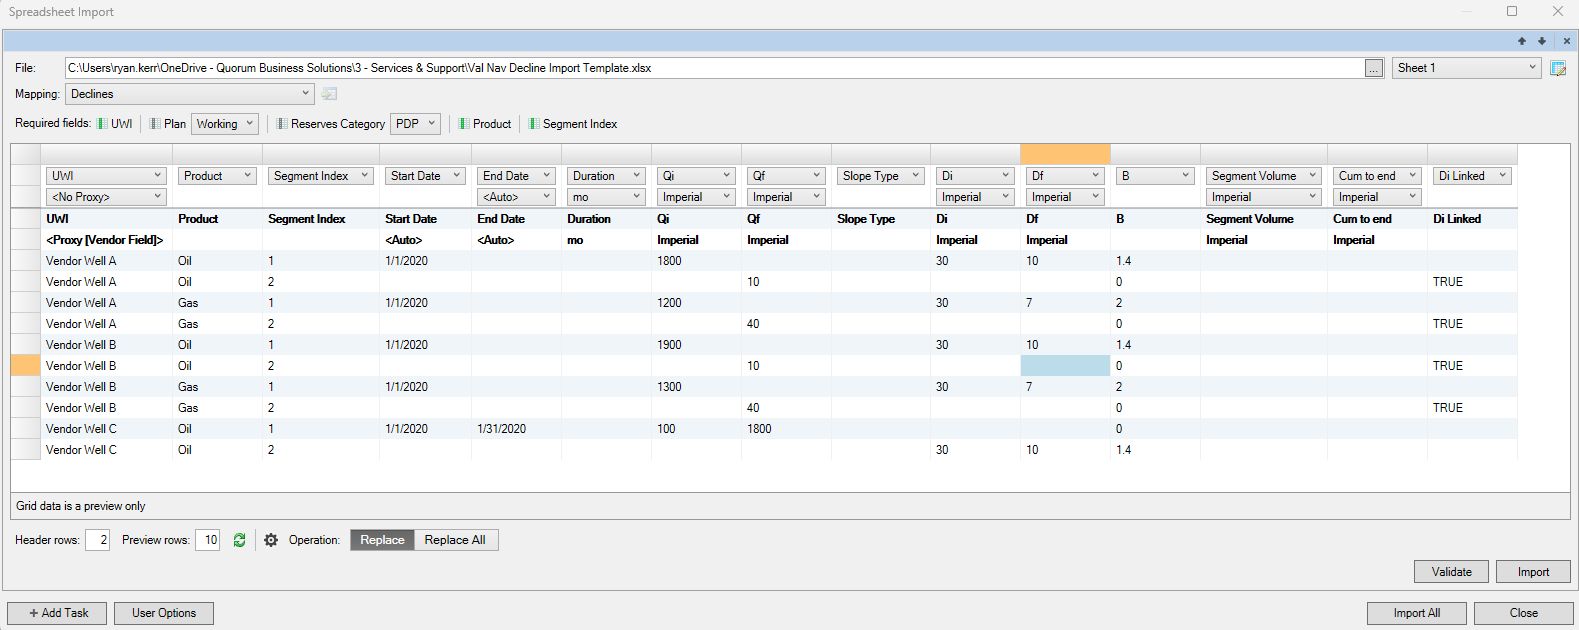
- In the import dialog, set Mapping to either Declines or Forecast Constants, depending on what you are importing.
- Choose the correct forecast destination, such as the appropriate Plan and Reserves Category.
- Set Header rows to 2.
- If the spreadsheet header names match the expected field names exactly, the remaining fields should auto-map automatically.
2.4. NGL Calculations
The NGL Calculations option allows you to export the results of the NGL calculations.