Nodal Analysis - Gas Lift Optimizer
1. Overview
This module within the Nodal Analysis section is designed to optimize gas lift performance for maximizing oil production under specific surface/subsurface setups and operating conditions.
Traditionally, evaluating the effect of different gas injection rates required manually saving multiple VLPs under different wellbore and surface configurations, then comparing their intersections with the IPR to identify the optimal operating conditions. This feature simplifies the workflow by combining IPR and VLP generation, gas lift rate variation, and case comparison into one streamlined tool. The GIF below demonstrates this simplified approach:
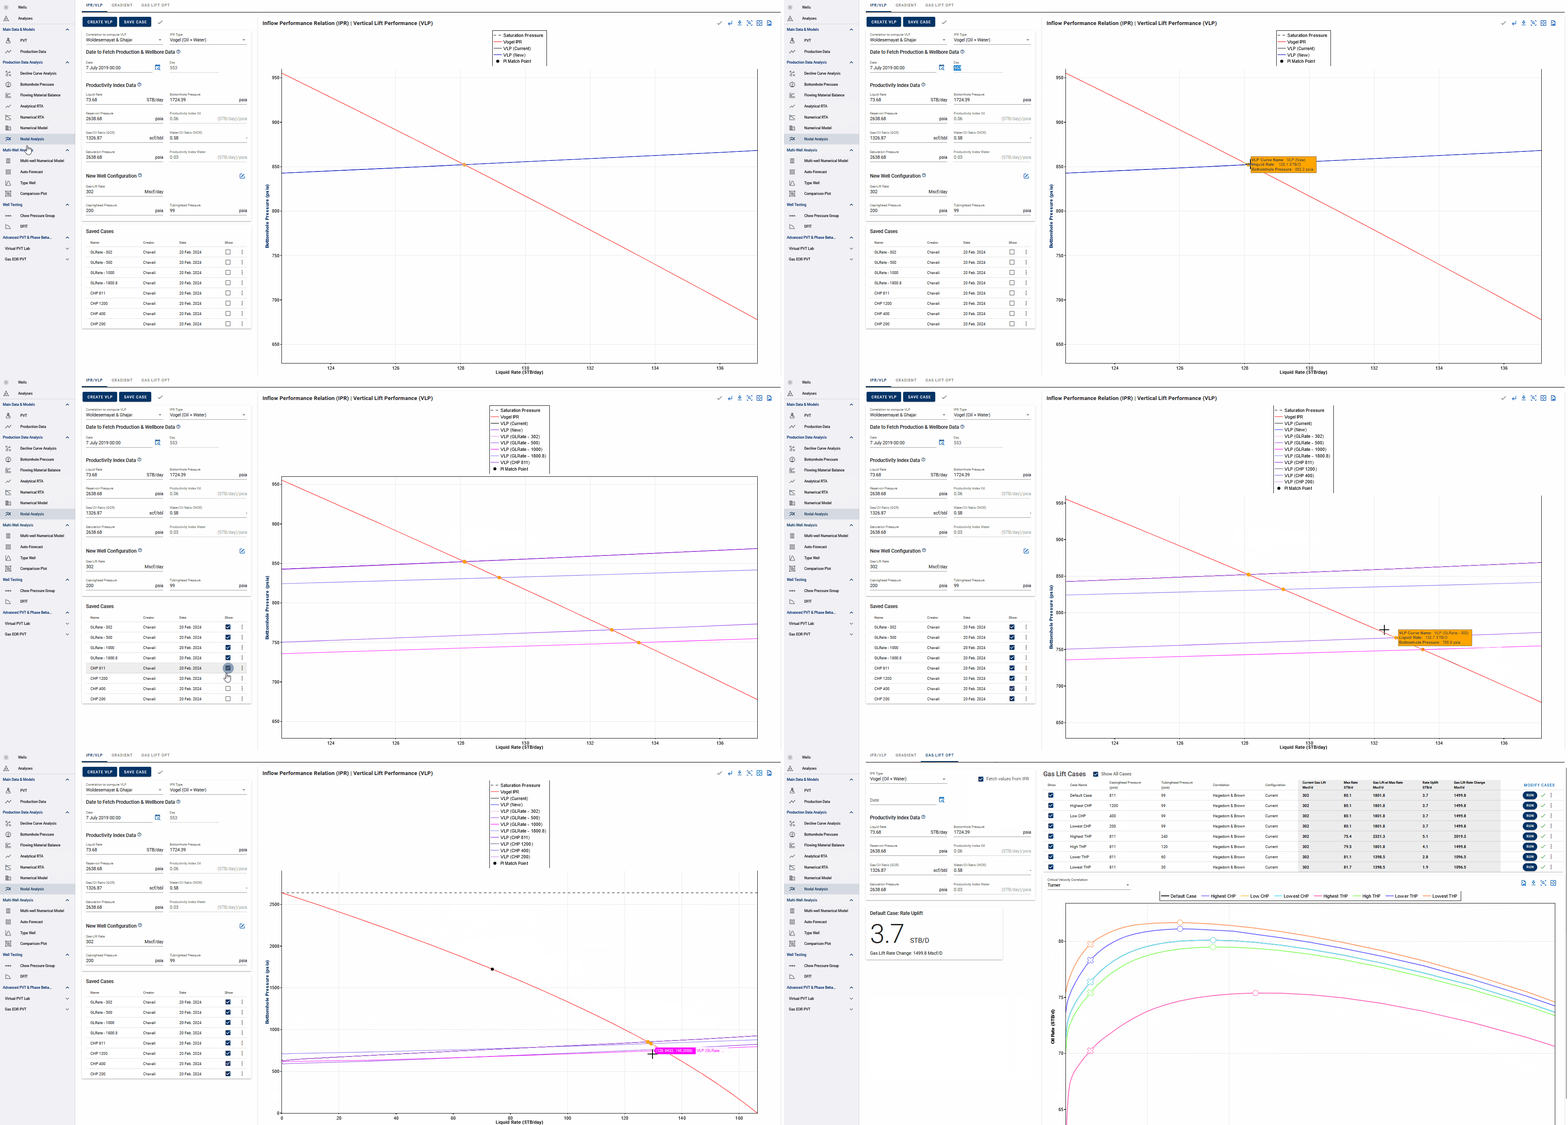
Within this tool, you can:
- Set up inflow performance relationships (IPRs) for specific dates in the well’s history.
- Test sensitivities on wellhead pressures (tubing and casing), bottomhole pressure correlations, and wellbore configurations.
- Evaluate the effect of changing gas lift injection rates.
- Quantify the oil rate uplift potential and optimize gas injection strategies.
The goal is to provide actionable insights for maximizing return on injected gas — whether that means adjusting wellbore hardware, tuning injection strategies, or redesigning surface conditions.
2. Basics
To begin, an IPR must be created in the IPR/VLP section for a selected date in the well’s production history. VLPs are generated based on:
- Surface pressures, including tubing and casing pressure,
- Gas-Oil Ratio (GOR),
- Gas lift injection rates,
- Bottomhole pressure (BHP) correlations,
- Wellbore configurations.
Each VLP that intersects the IPR represents an operating point, or the expected oil rate under a specific set of operating conditions. By generating multiple VLPs at different gas lift injection rates, a gas lift optimization curve is built by plotting oil rate against gas injection rate.
Typically, oil rate increases with gas injection until the added friction from excessive gas reduces the benefit. The optimization curve helps identify:
- The current operating point,
- The maximum achievable oil rate,
- The required gas injection rate to reach the optimum,
- The expected oil rate uplift,
- The additional or reduced gas lift required to reach the optimum.
These values support decisions related to gas allocation, surface facility design, and economic planning.
2.1. Workflow
-
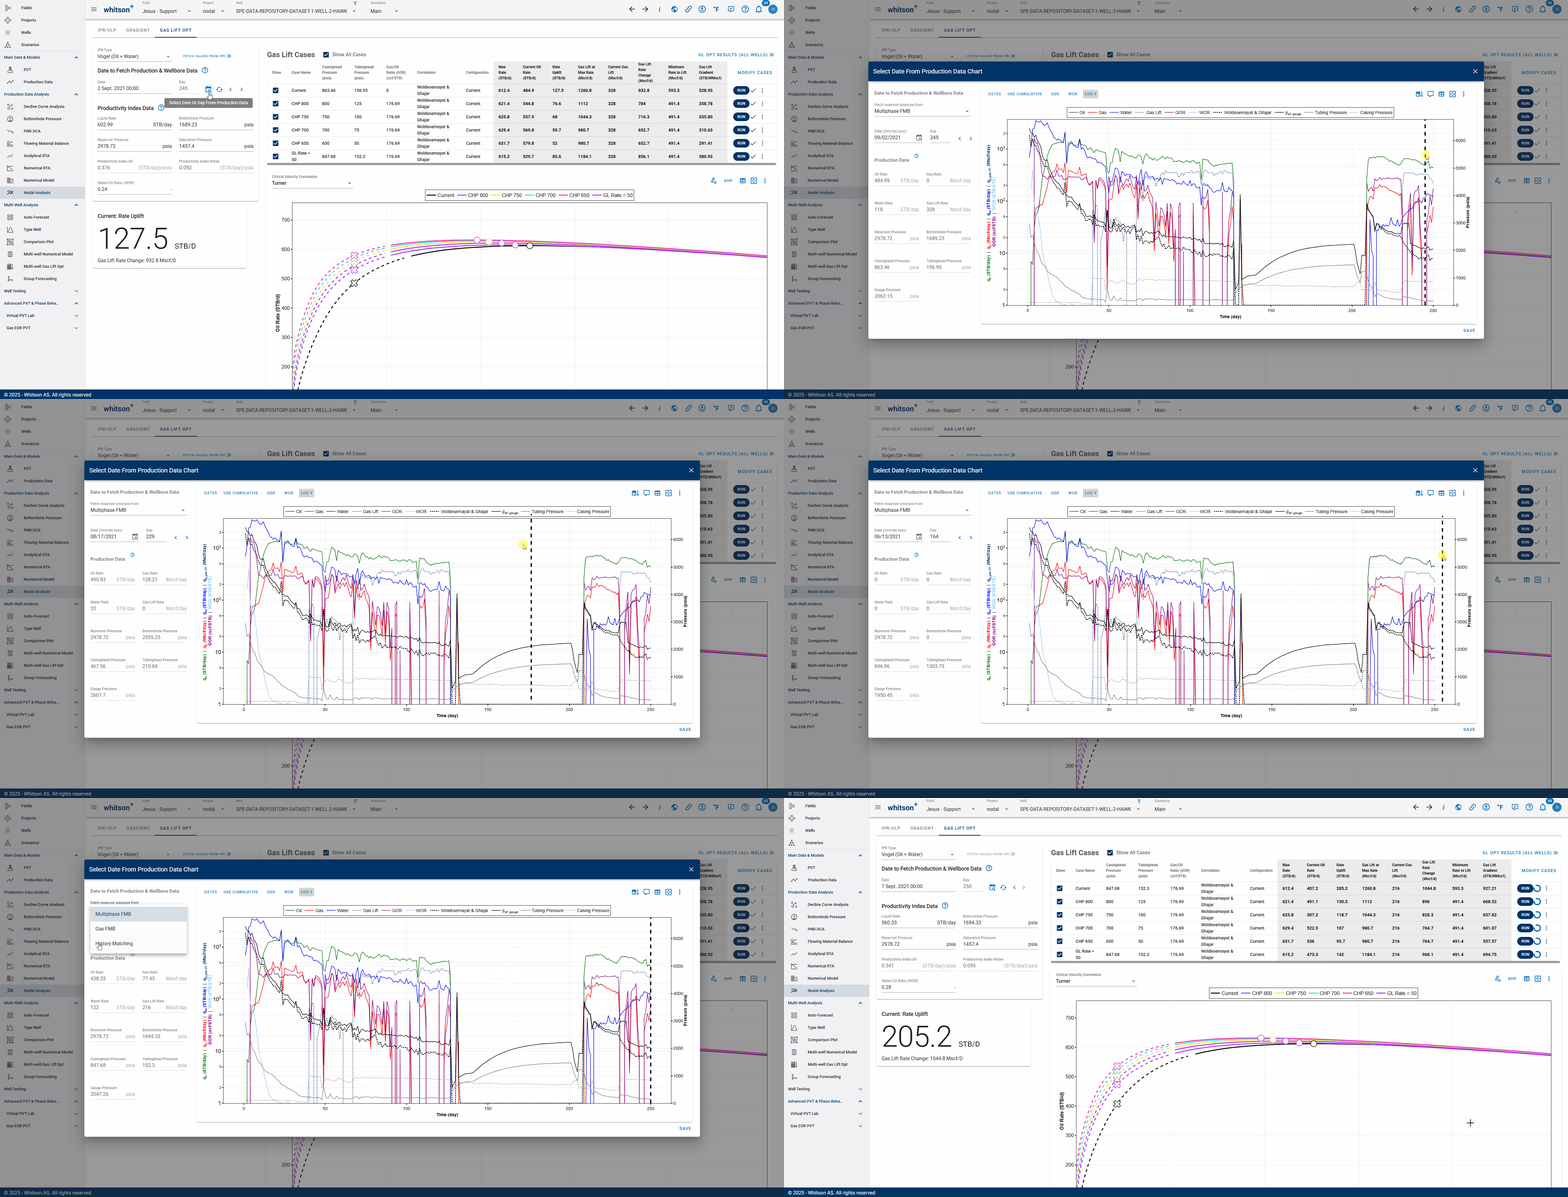
In the IPR/VLP section, select the date for IPR generation by clicking the calendar icon. You can manually enter the date and view the corresponding rates and pressures for the selected day. Additionally, you can fetch the reservoir pressure calculation from your preferred simulation, such as Multiphase FMB, Gas FMB, or History Matching, provided that these simulations have been previously completed.
-
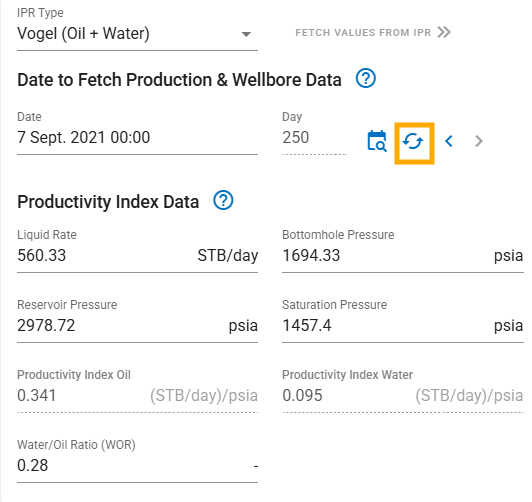
The current IPR and related inputs are loaded into the optimizer on first access. You can fetch the data from the selected date by clicking the refresh icon or you can manually input desired values into each field.
Fetched Values
If a date is specified and the required data is available, the following values are automatically populated:
- Liquid Rate is calculated from the production data input.
- Gas/Oil Ratio is calculated from the production data input.
- Water/Oil Ratio is calculated from the production data input.
- Bottomhole Pressure is fetched from the Bottomhole Pressure feature.
- Reservoir Pressure is fetched from the Flowing Material Balance feature.
- Saturation Pressure is fetched from the PVT feature.
Some values must be manually specified if they are not available.
Productivity Index is calculated from the liquid rate and the specified pressures using the Vogel IPR method.
-
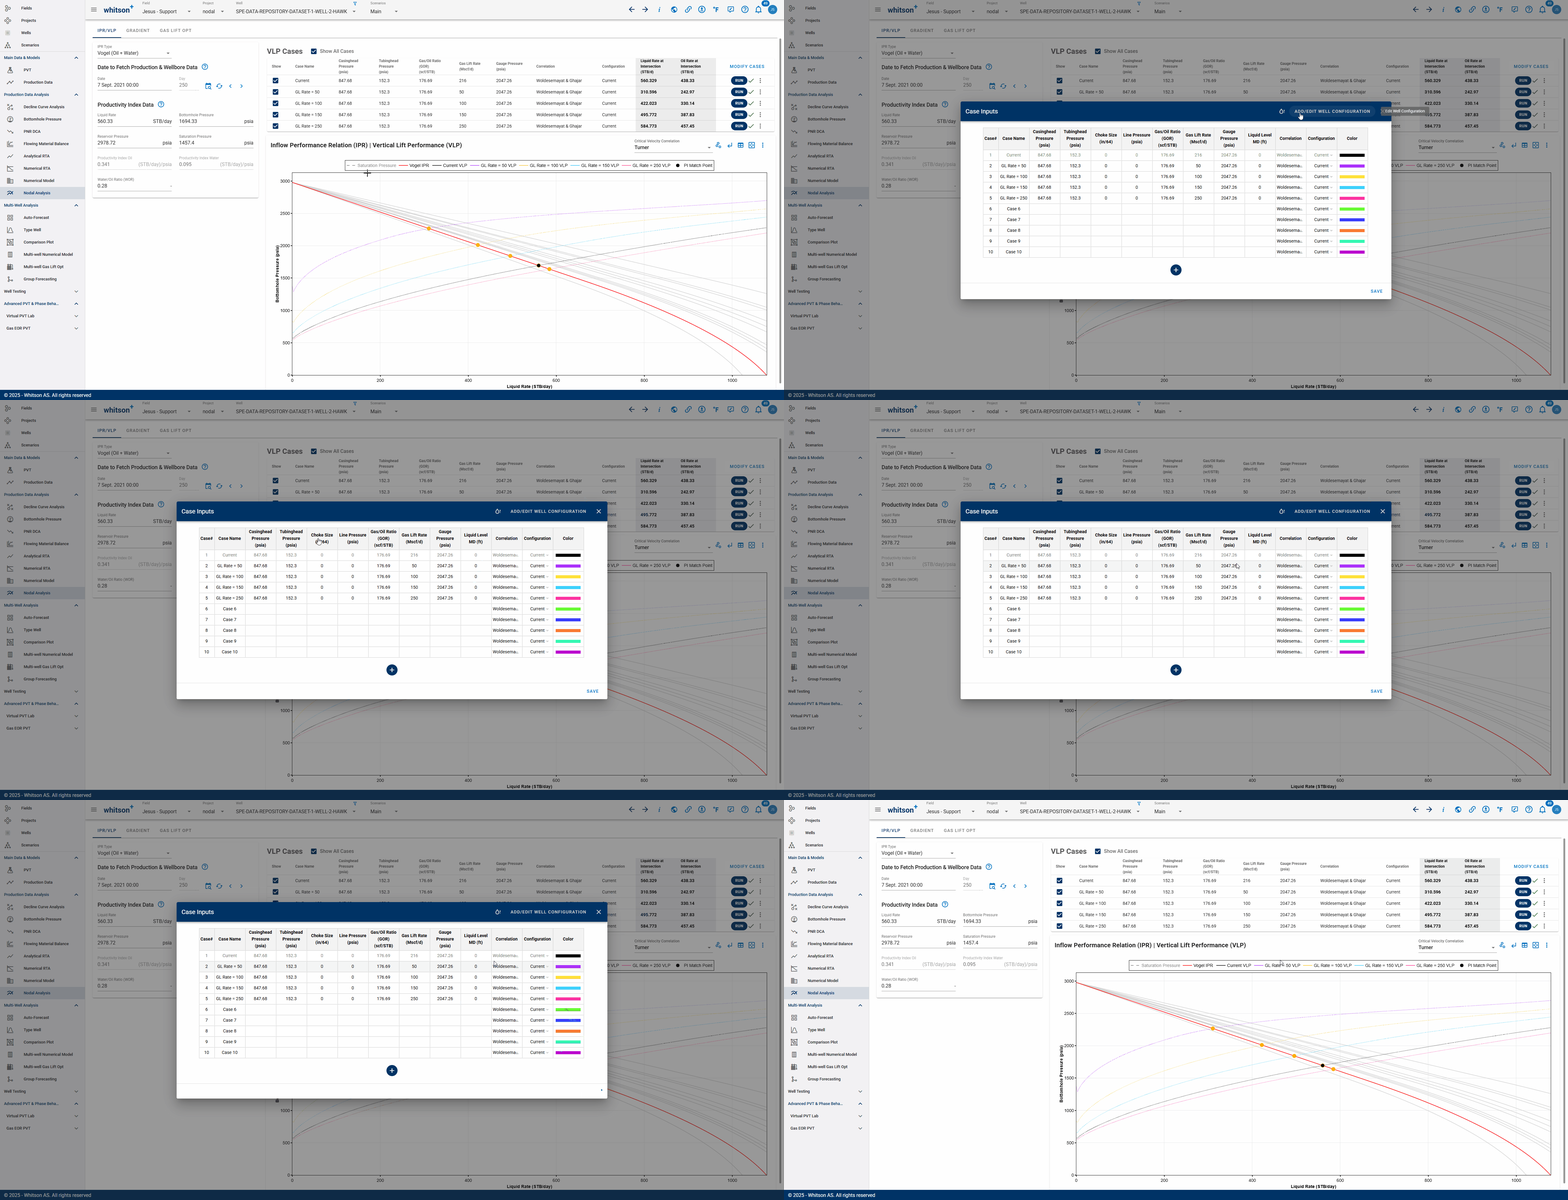
Use the MODIFY CASES button to create multiple sensitivity cases, varying:
- Wellhead pressures (CHP and THP)
- Gas-Oil Ratio (GOR)
- BHP correlation
- Wellbore configuration
- Tubing ID
- Gas Lift Valve Depth
- Critical Rate Options / Erosion Options
-
Save and run the cases – optimization curves are generated automatically.
- Review optimization curves and summary tables for all cases.
2.2. Average IPR
Use an averaged IPR over a date window to smooth noisy daily data before running optimization. The optimizer will then use this representative IPR for all VLP cases.
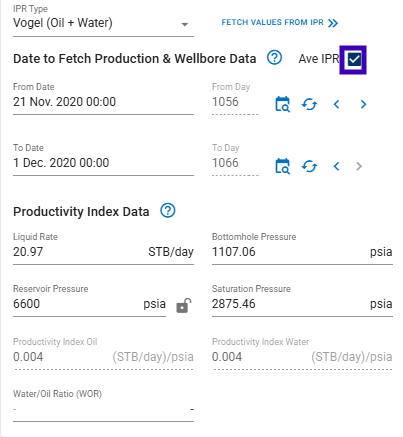
- In IPR / VLP, select Average IPR and set the Start Date and End Date.
- Confirm streams and pressures, then generate the averaged IPR.
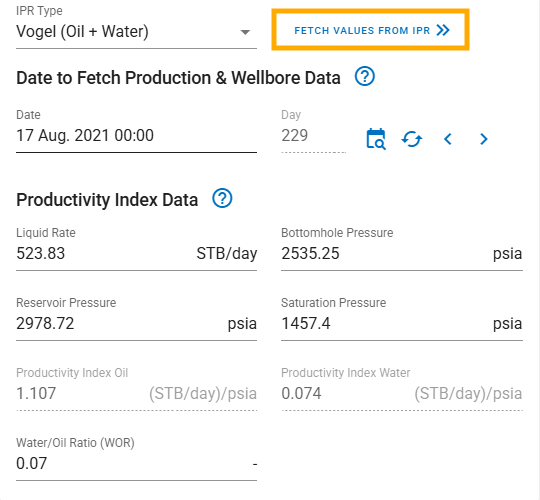
- Return to Gas Lift Optimizer and click Fetch values from IPR to load the averaged curve.
- Run or re-run your cases. The optimization curve will be based on the averaged IPR.
2.3. Economic Optimization
Economic Optimization allows users to evaluate gas lift performance based on both production response and economic assumptions. When enabled, the optimizer estimates the most economic gas lift rate by comparing the value of the produced hydrocarbons against the cost of the injected lift gas. This means the economic optimum may differ from the gas lift rate that produces the maximum oil rate.
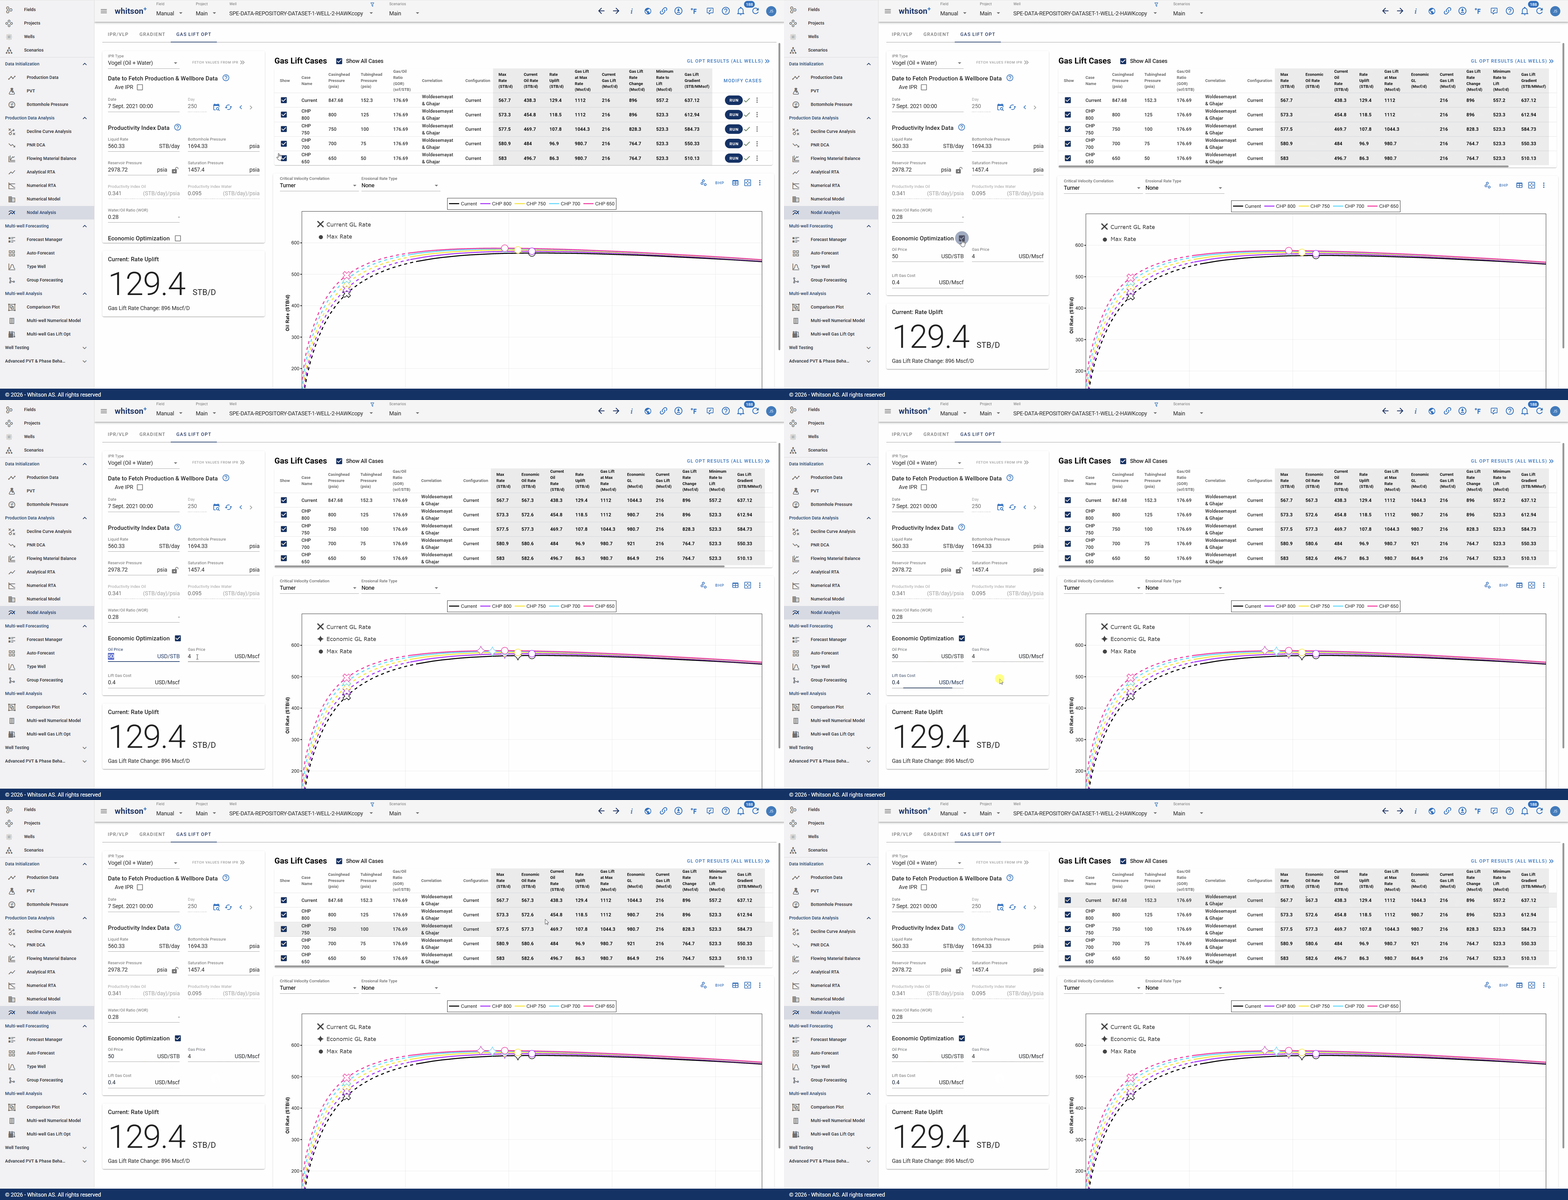
The following inputs are used for the economic optimization:
- Oil Price: The assumed oil sales price used to estimate the value of oil production.
- Gas Price: The assumed gas sales price used to estimate the value of gas production.
- Lift Gas Cost: The assumed cost of supplying or compressing lift gas. This cost is subtracted from the production value to determine whether additional gas injection is economically justified.
The economic optimum is calculated by evaluating the profit at each point on the gas lift optimization curve and selecting the point with the highest value.
For oil wells, the profit is calculated as:
where:
- is the oil rate from the gas lift optimization curve.
- is the oil price.
- is the gas price.
- is the hydrocarbon ratio. For oil wells, this is treated as the producing GOR.
- is the gas lift injection rate.
- is the lift gas cost.
For gas wells, the same logic is applied, but the calculation is based primarily on gas revenue. In this case, the hydrocarbon ratio is used to include the associated liquid value.
where:
- is the gas rate from the gas lift optimization curve.
- is the hydrocarbon ratio. For gas wells, this is treated as the associated liquid yield.
- The remaining terms follow the same definitions as above.
When Economic Optimization is enabled, the results table includes the economic optimum in addition to the maximum production case.
In this case:
- Max Rate represents the highest predicted oil rate.
- Gas Lift at Max Rate represents the gas lift injection rate required to reach the maximum oil rate.
- Economic Oil Rate represents the oil rate at the most economic gas lift rate.
- Economic GL represents the gas lift injection rate that maximizes calculated profit based on the selected oil price, gas price, and lift gas cost.
This helps users determine whether it is better to maximize oil production or operate at a lower gas lift rate that provides better economic performance.
3. Case Comparisons
3.1. Varying Wellhead Pressures
This example compares different combinations of casing and tubing head pressures (CHP, THP). The base case reflects current operating conditions, while other cases simulate surface pressure changes.
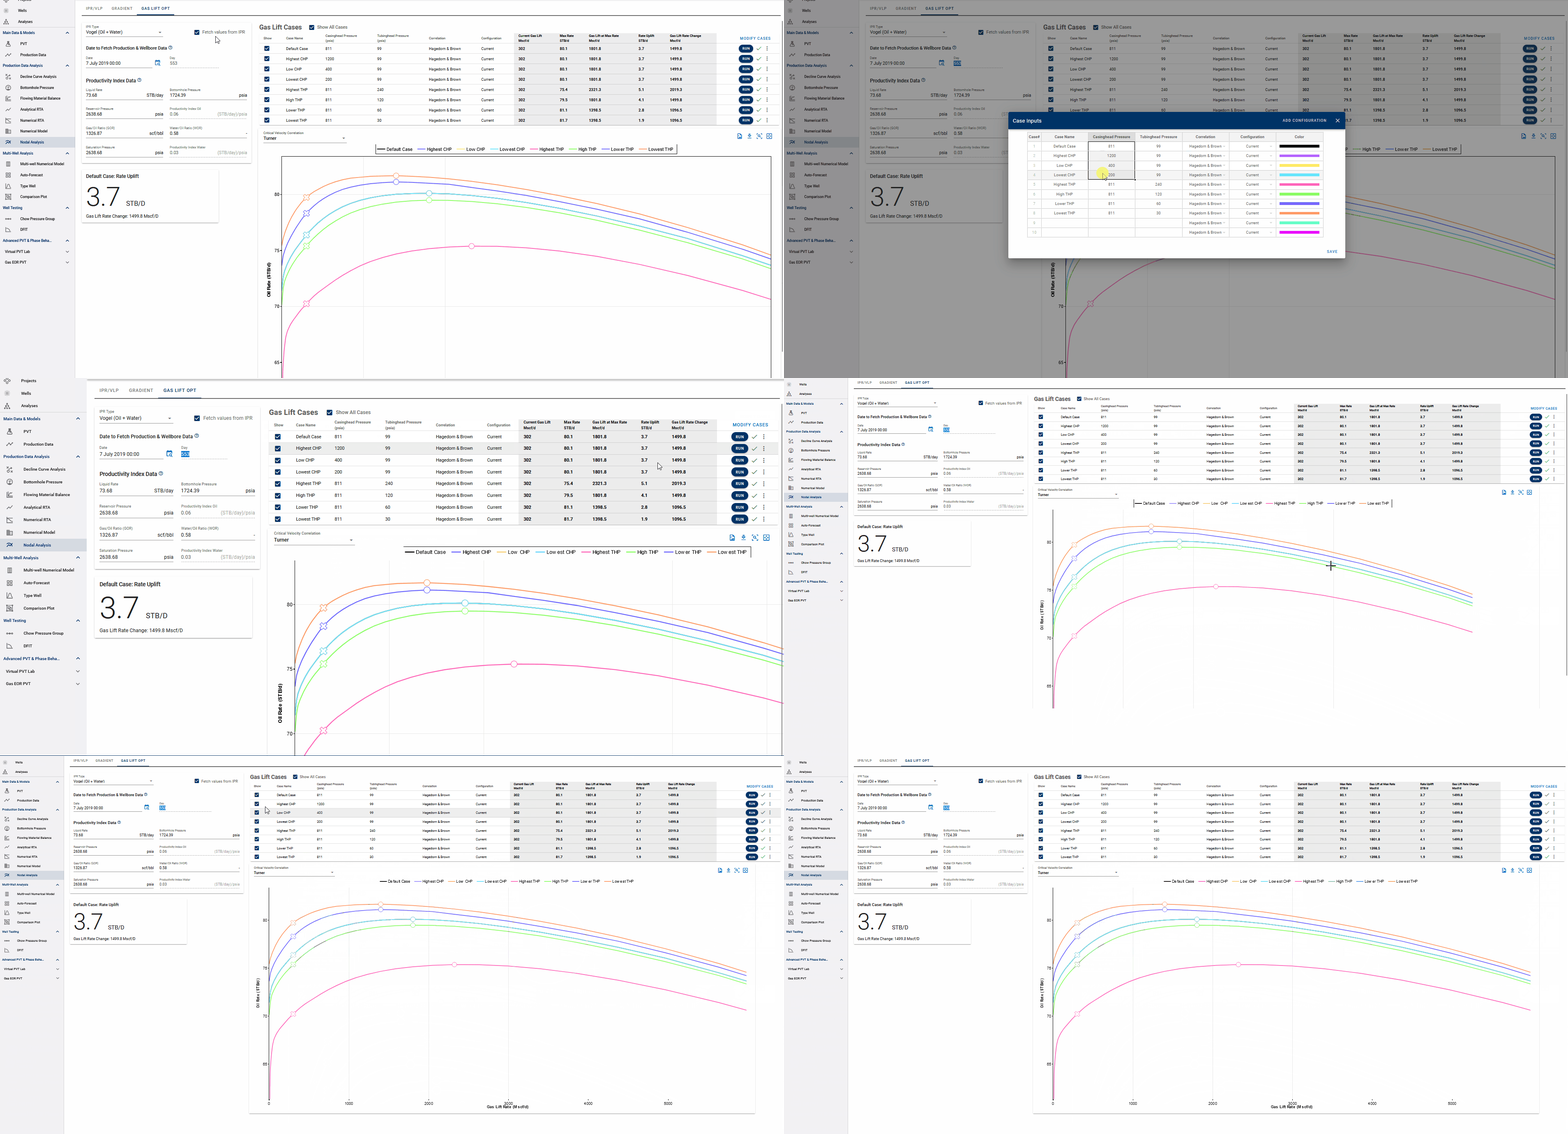
In this example, a ~125 STB/D rate uplift is achievable by increasing gas injection by ~900 Mscf/D. Alternatively, reducing THP to achieves similar gains without increasing injection.
Impact of Surface Pressure on Gas Lift Optimization
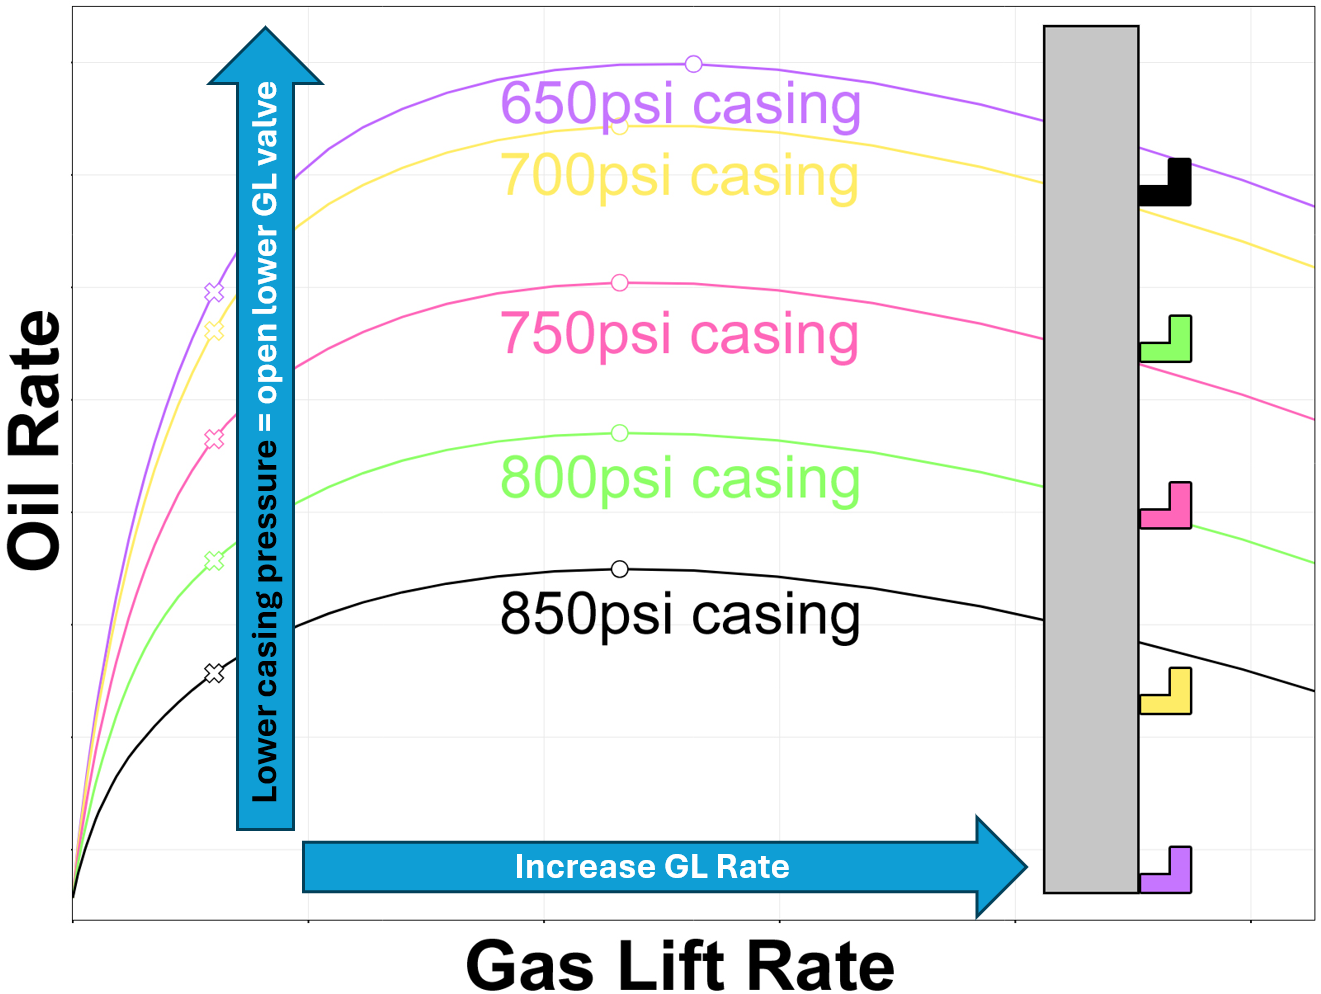
Varying CHP may have no effect in single-valve systems, but in multi-valve wells, it changes the depth of gas entry—thus affecting optimization.
3.2. Varying BHP Correlations
Here, only the VLP correlation is varied, showing how each VLP responds as gas injection increases. Each correlation produces a different response to gas injection.
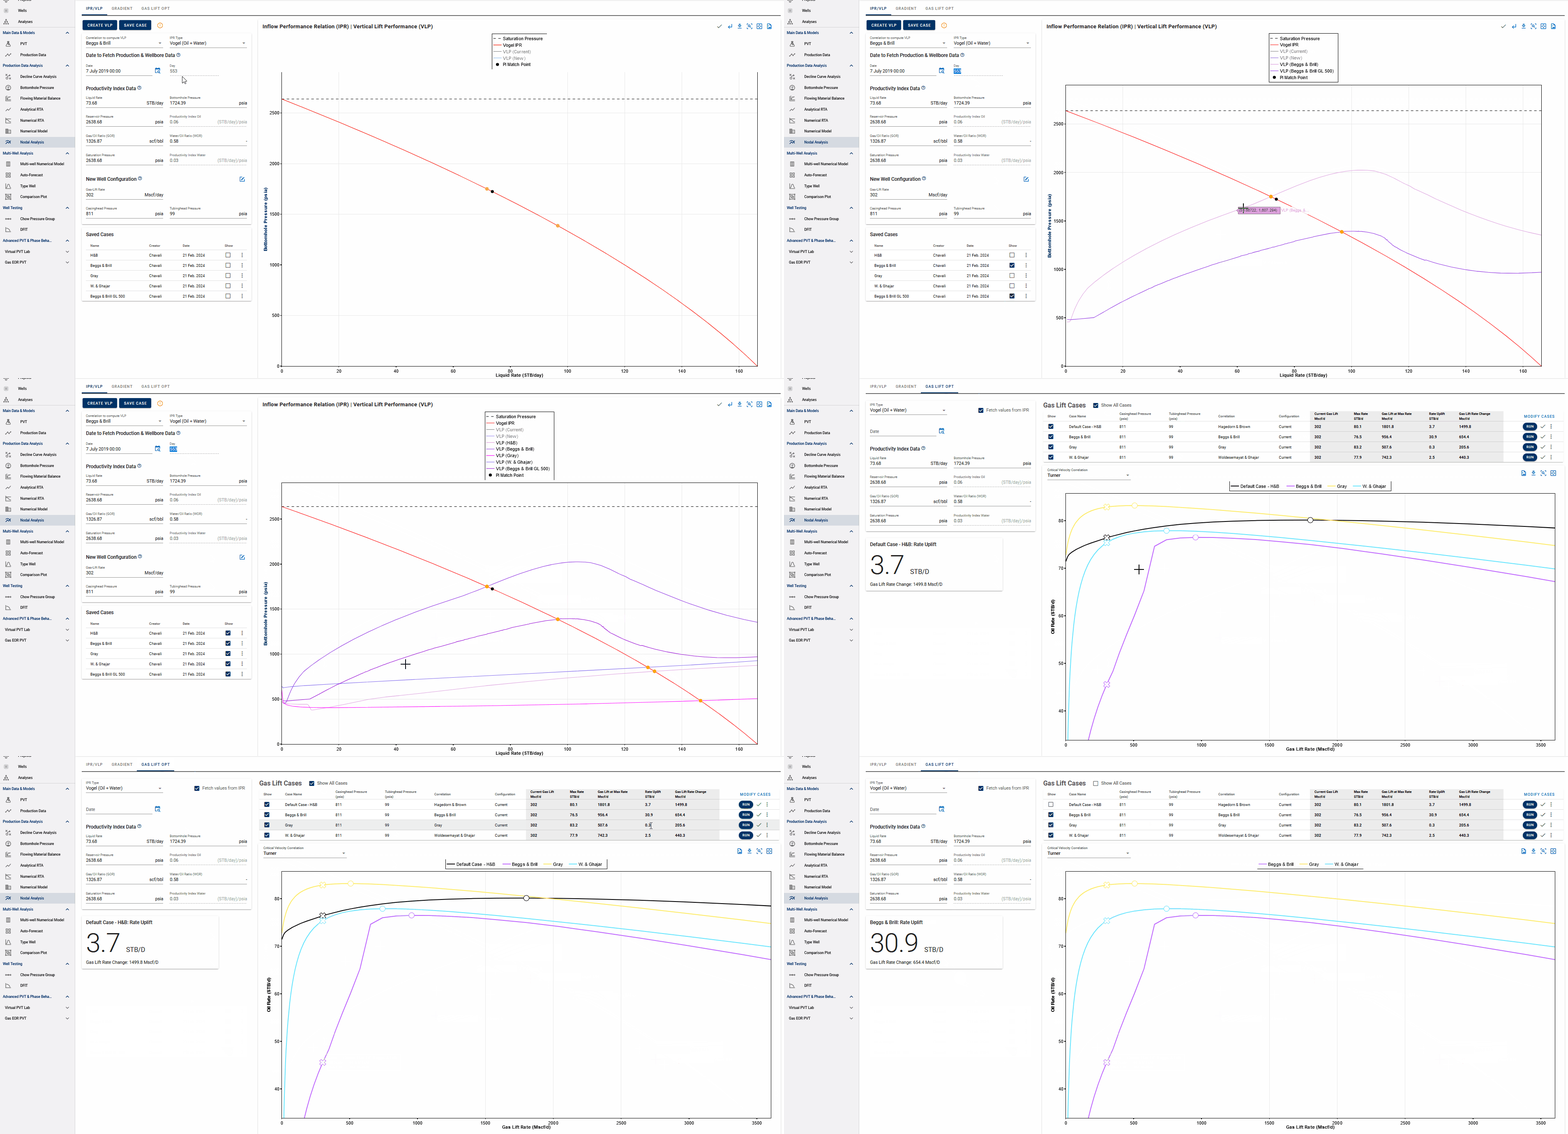
For this well, the Woldesemayat & Ghajar correlation yields the best match with the IPR. It shows a potential uplift of 129.3 STB/D with an increase of ~900 Mscf/D in gas injection.
3.3. Comparing Wellbore Configurations
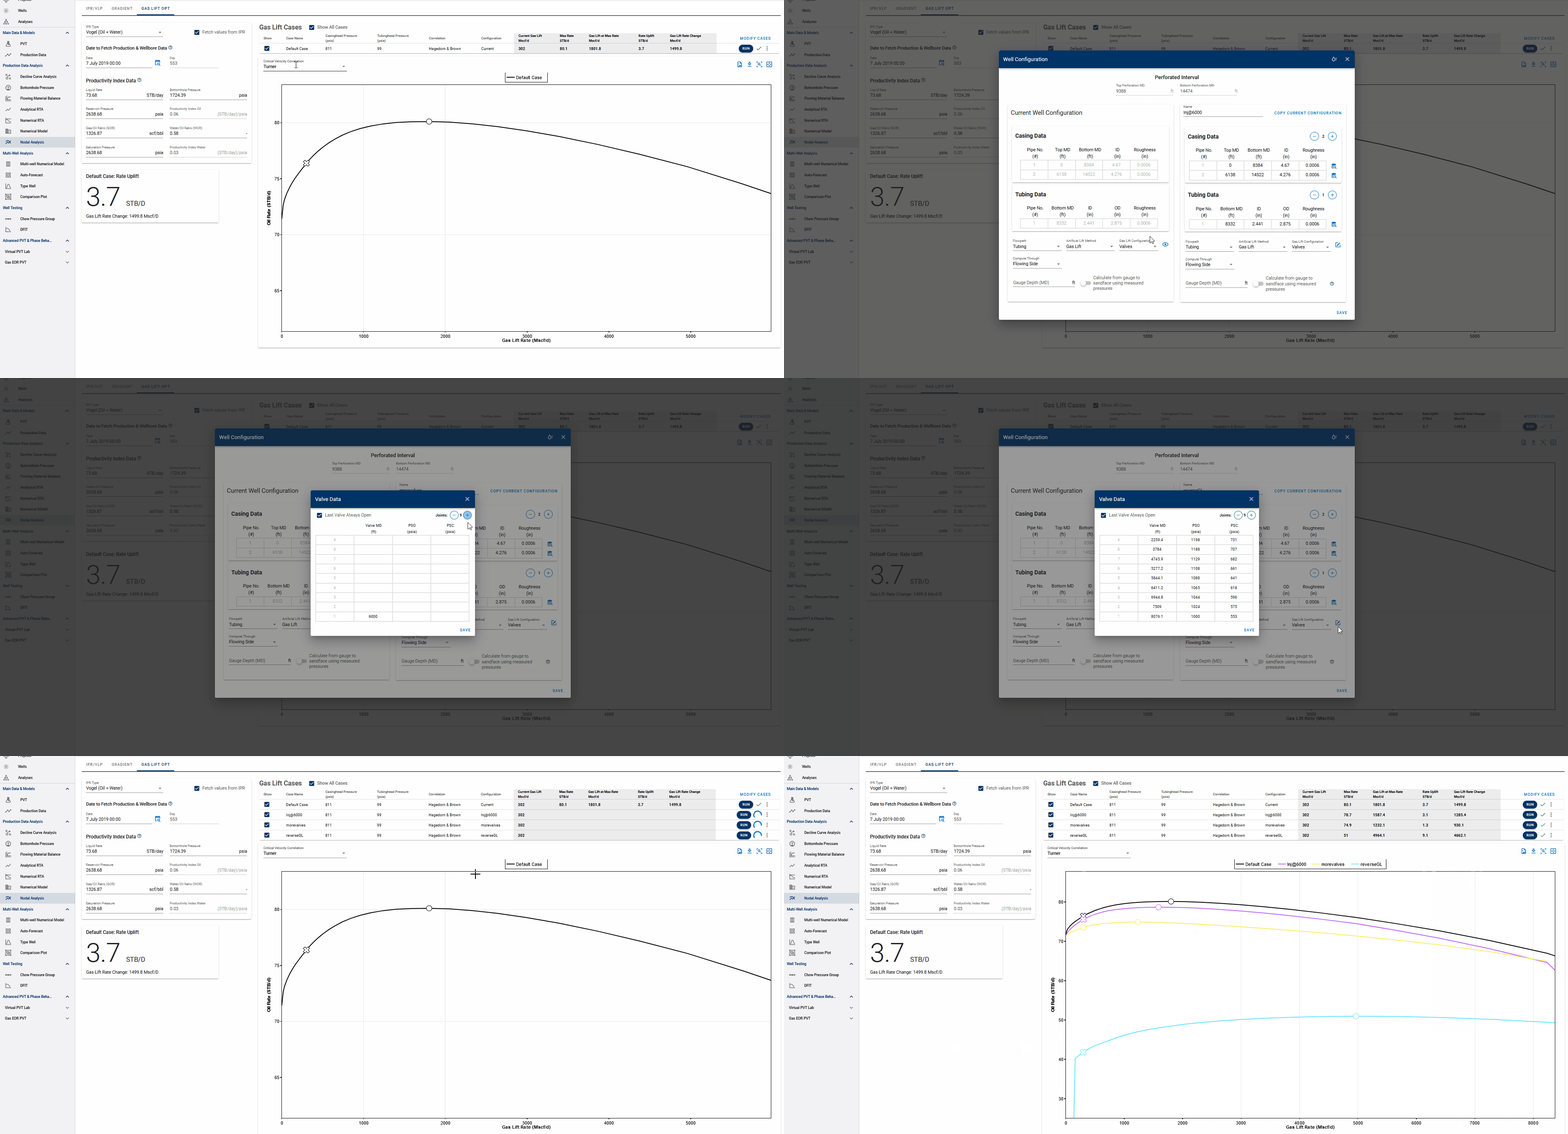
This requires the alternative wellbore configurations to be gas-lift configurations. You can add or remove valves from the tubing, adjust valve depths, opening and closing pressures, and compute the gas lift optimization curve for alternate gas lift designs.
4. Multi-point Sampling for GLO
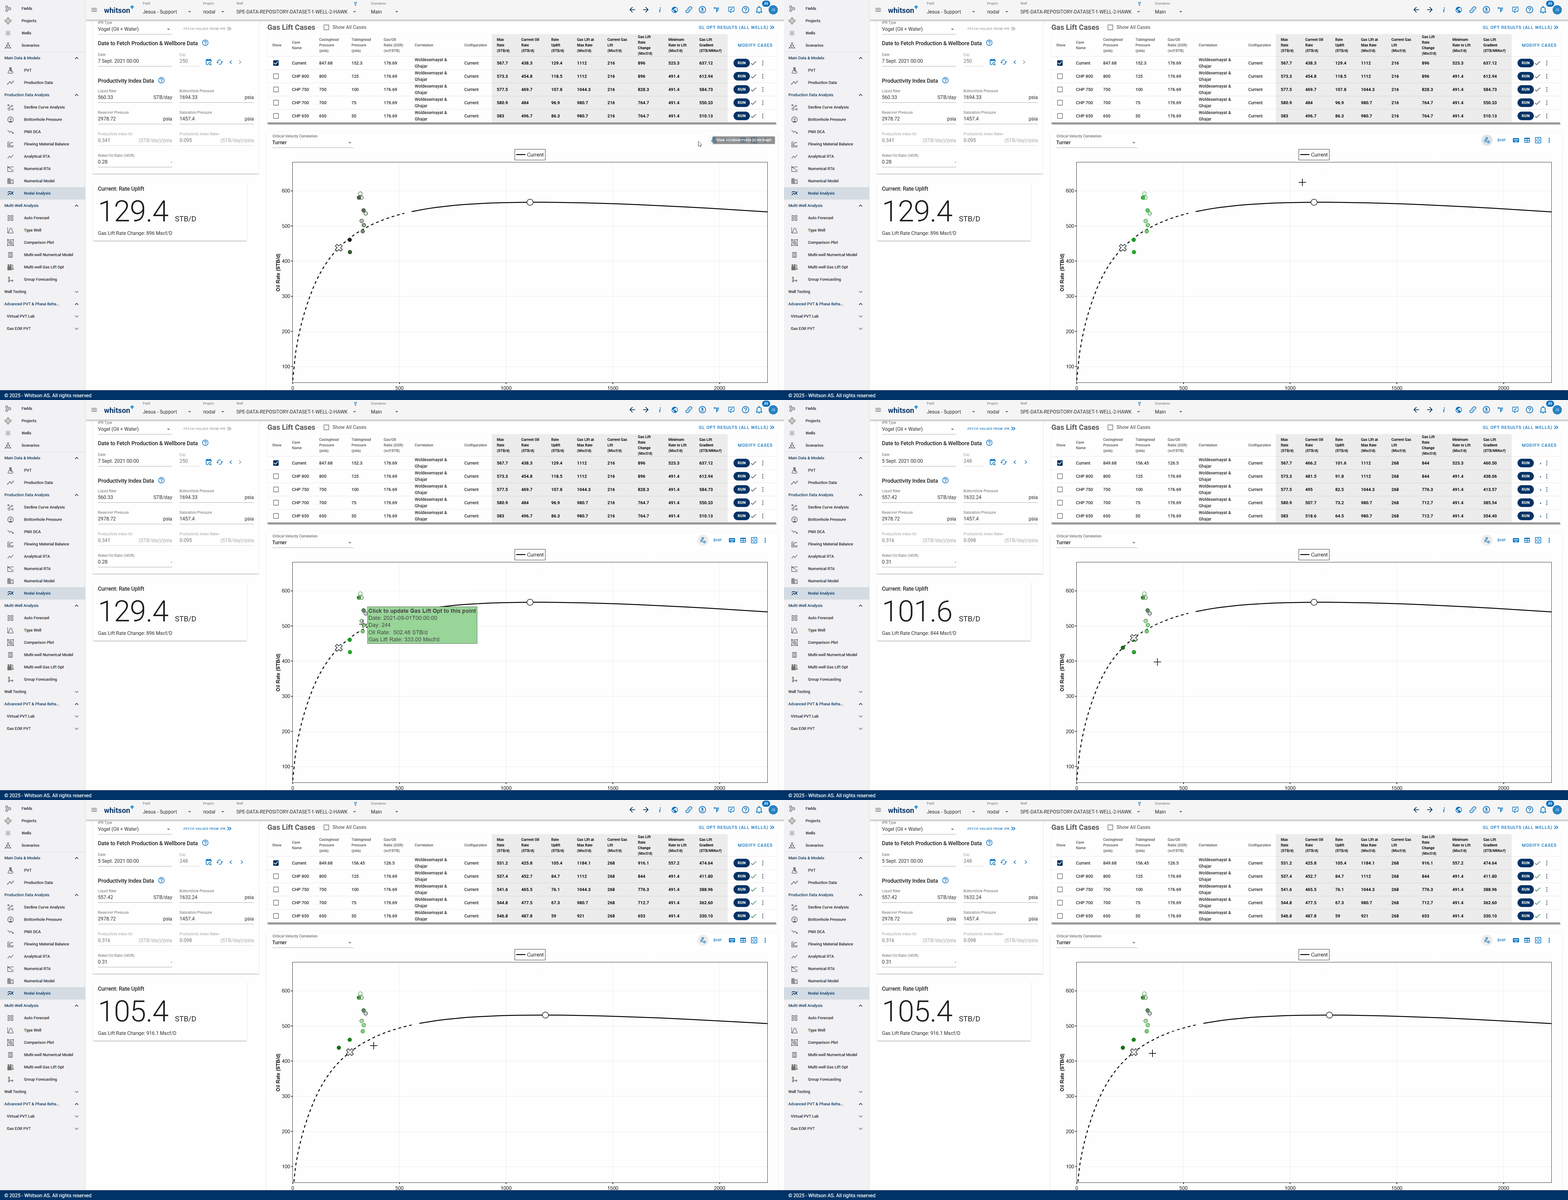
Select a more representative GLO case by minimizing the impact of outliers. A 10-day production history is used to visualize the range of possible optimization results and help identify the most consistent operating trend.
Show Additional Points on the Graph - You can display liquid rate and bottomhole pressure (BHP) points from other dates on the IPR/VLP graph. These points still originate from IPR/VLP calculations, but the plot will dynamically compute and display the gas lift optimization (GLO) results for the selected point. This allows you to compare GLO outcomes across different operating conditions using historical data. Selecting a point automatically updates the graph with the corresponding IPR/VLP inputs and shows the GLO result, making it easier to track changes in performance and assess optimization potential over time.
5. GLO Opt Results
The GLO Opt Results section in whitson+ is a centralized workspace for reviewing and comparing the outcomes of gas lift optimization cases. Users can evaluate multiple optimization scenarios derived from different wells or sensitivities, such as pressures or gas lift rates, using intuitive comparison tools paired with a result table. Only the “current” optimization case for each well is shown in the table, and the values displayed are based on the date from which the production data was fetched. You can access the GLO Opt Results table from the Gas Lift Optimization section in the Nodal Analysis tab or from the Wells section by selecting "Results." The GIF below demonstrates this process.
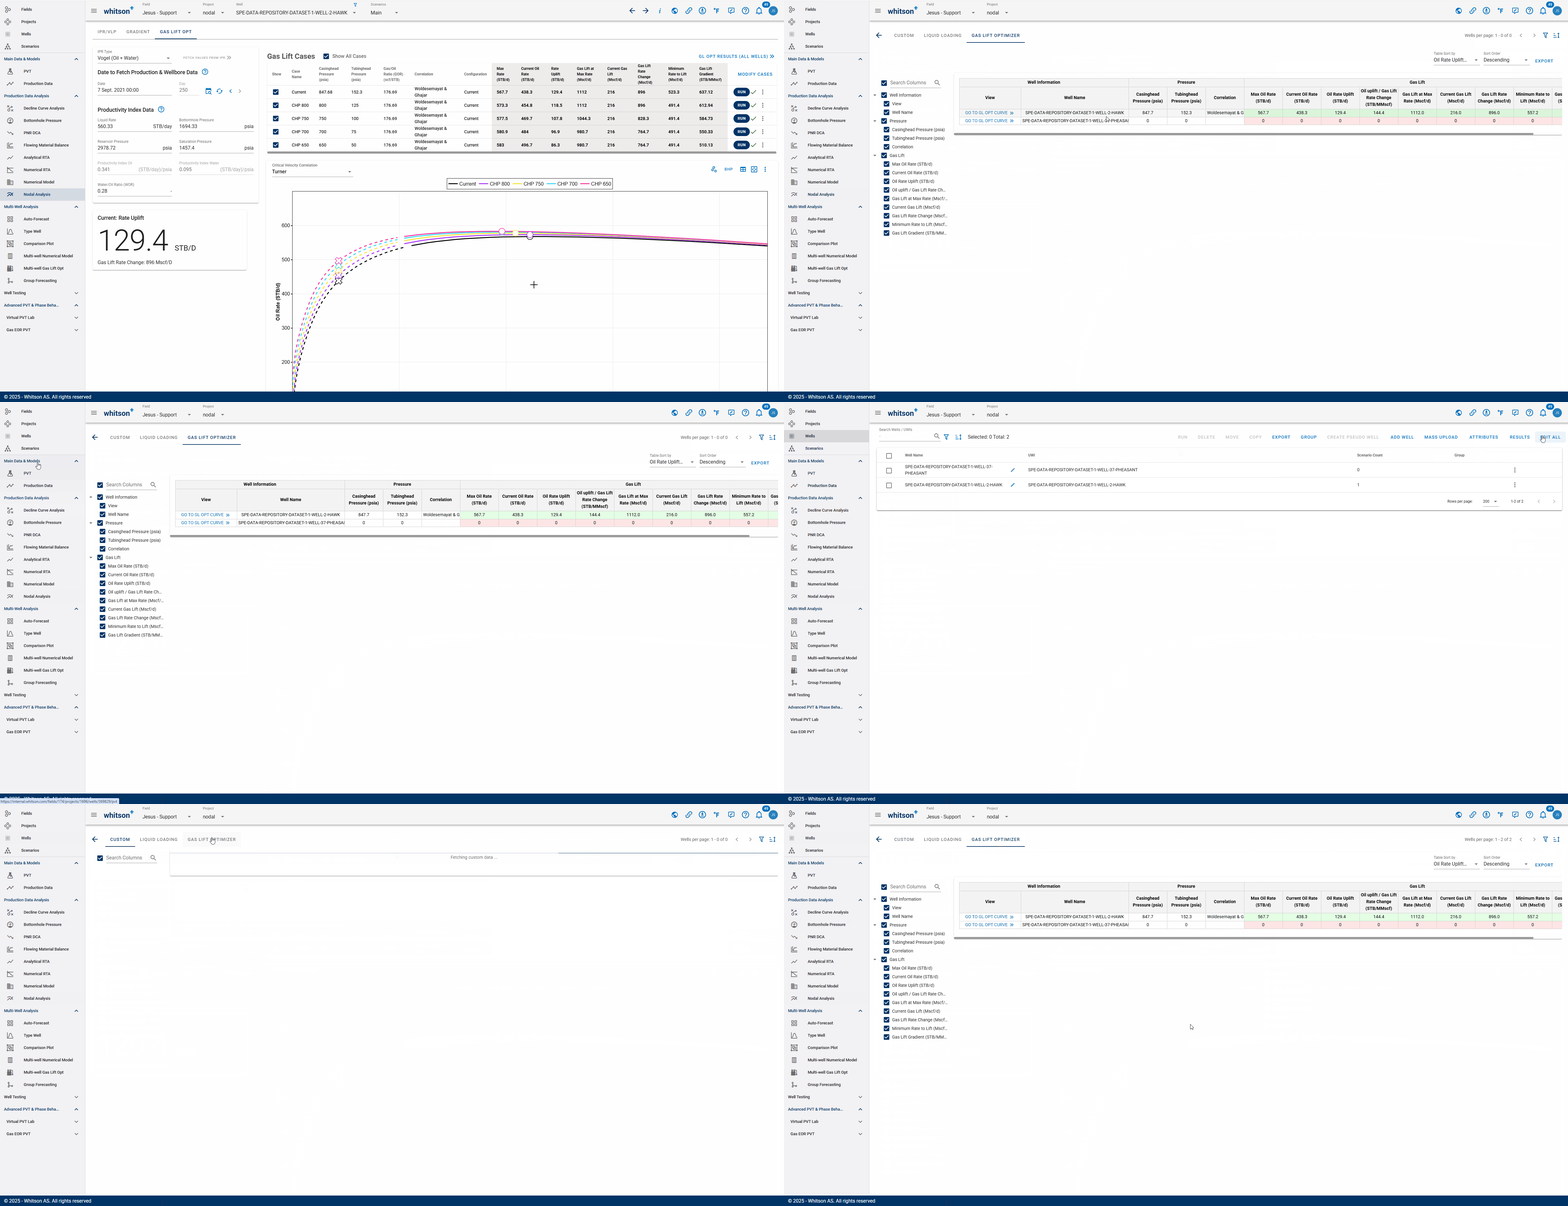
The resulting summary table reports the key gas lift optimization outputs:
| Column | Description |
|---|---|
| Max Rate | The highest predicted production rate from the gas lift optimization curve. |
| Current Oil Rate | The oil rate at the current operating gas lift injection rate. |
| Rate Uplift | The expected increase in oil rate from moving from the current operating point to the maximum-rate operating point. This is calculated as Max Rate - Current Oil Rate. |
| Gas Lift at Max Rate | The gas lift injection rate required to achieve the maximum predicted production rate. |
| Current Gas Lift | The current gas lift injection rate used for the selected well and date. |
| Gas Lift Rate Change | The change in gas lift injection required to reach the maximum-rate operating point. This is calculated as Gas Lift at Max Rate - Current Gas Lift. |
| Minimum Rate to Lift | The minimum gas lift injection rate required for the well to lift under the selected operating conditions. |
| Gas Lift Gradient | The oil rate uplift per unit of gas lift change at the current operating point. This indicates how efficiently additional gas lift converts into incremental oil production. |
| Economic Oil Rate | The production rate corresponding to the most economic gas lift rate. This is the rate at the point with the highest calculated profit based on oil price, gas price, lift gas cost, and hydrocarbon ratio. |
| Economic GL | The gas lift injection rate that maximizes calculated profit. This value may be lower than the gas lift rate required to reach the maximum production rate if the additional production does not justify the added lift gas cost. |
6. Tips
6.1. IPR Selection
Finalize the IPR to be used in the IPR/VLP section. Then, in the Gas Lift Optimization tab, ensure the correct values are populated for creating the underlying IPR by clicking 'Fetch values from IPR'. Each time the IPR is updated, the cases will automatically re-run.
6.2. Running a Case
Each time a case is updated, it will run automatically and update the gas lift optimization curve. There is no need to re-run when directly modifying a case input. However, if the IPR changes, you must manually re-run each case to refresh the optimization results.

6.3. New Wellbore Configurations
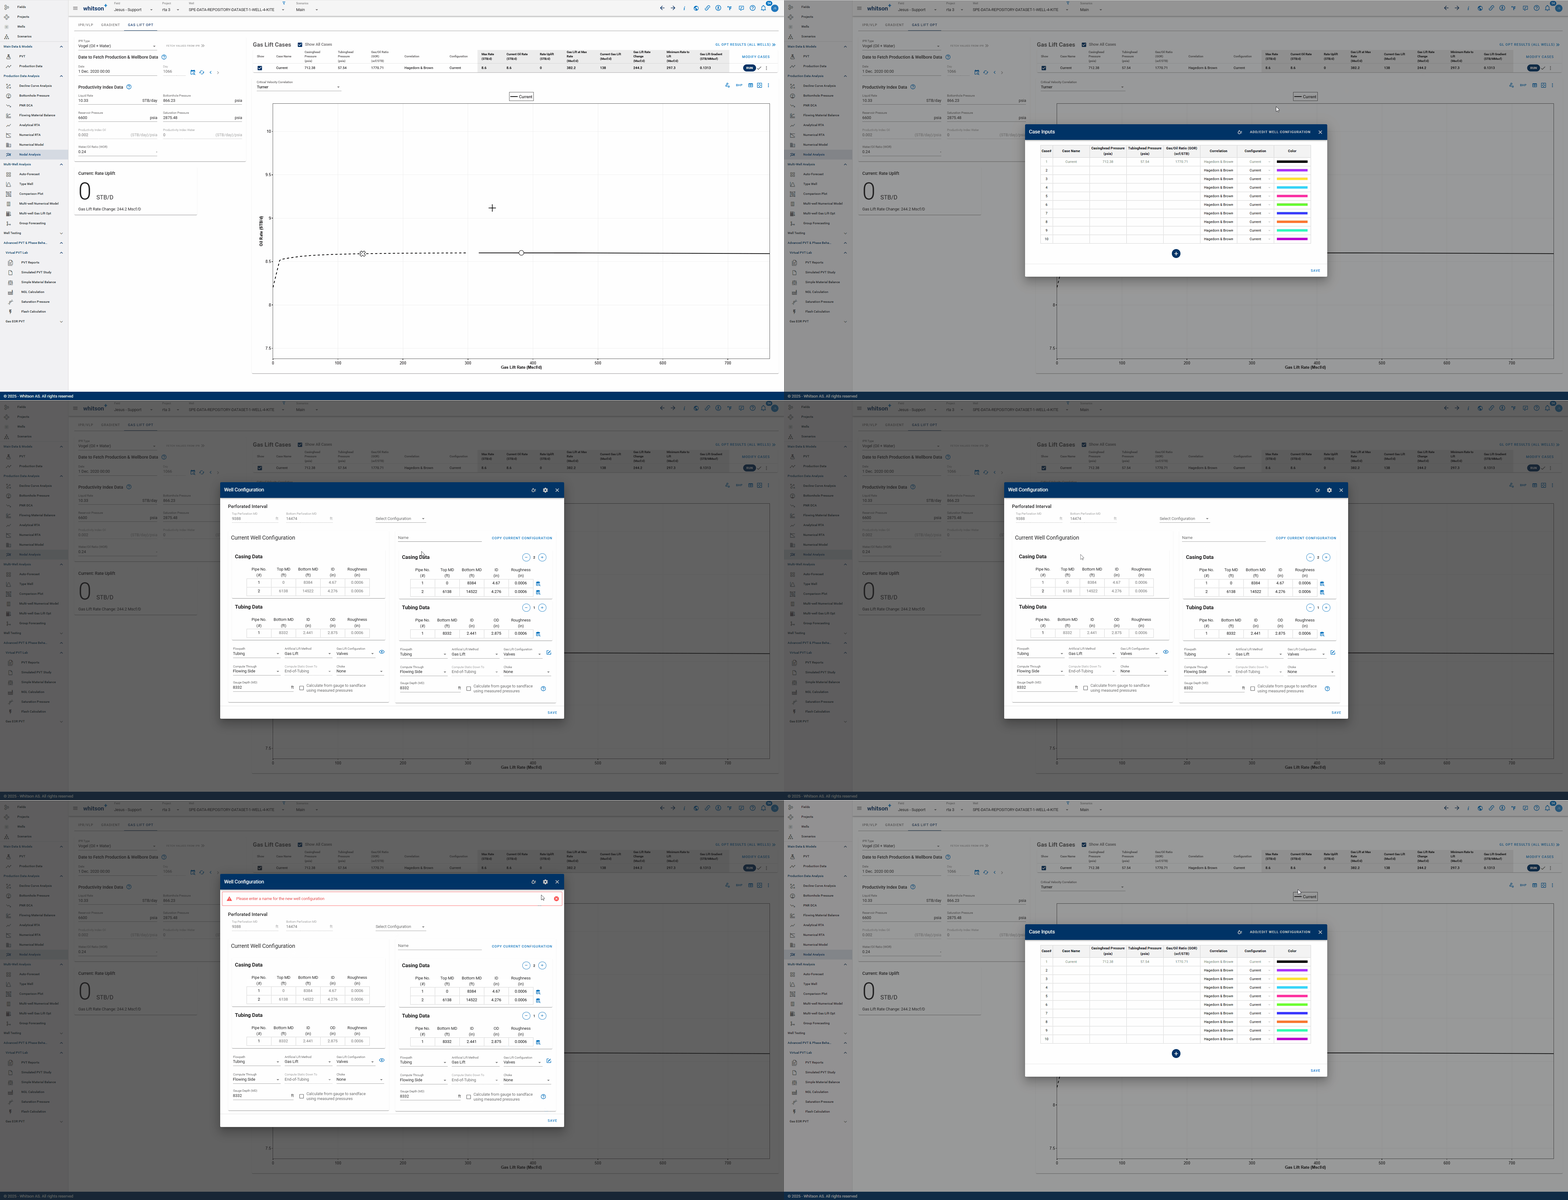
You can also compare new wellbore configurations by clicking the Add/Edit Well Configuration button. From there, you can either copy the current configuration or build a completely new one from scratch. Be sure to give it a name and save it.
Once you return to the case inputs, use the Configuration dropdown to select your newly created configuration by its saved name.
6.4. Send to GLO Opt
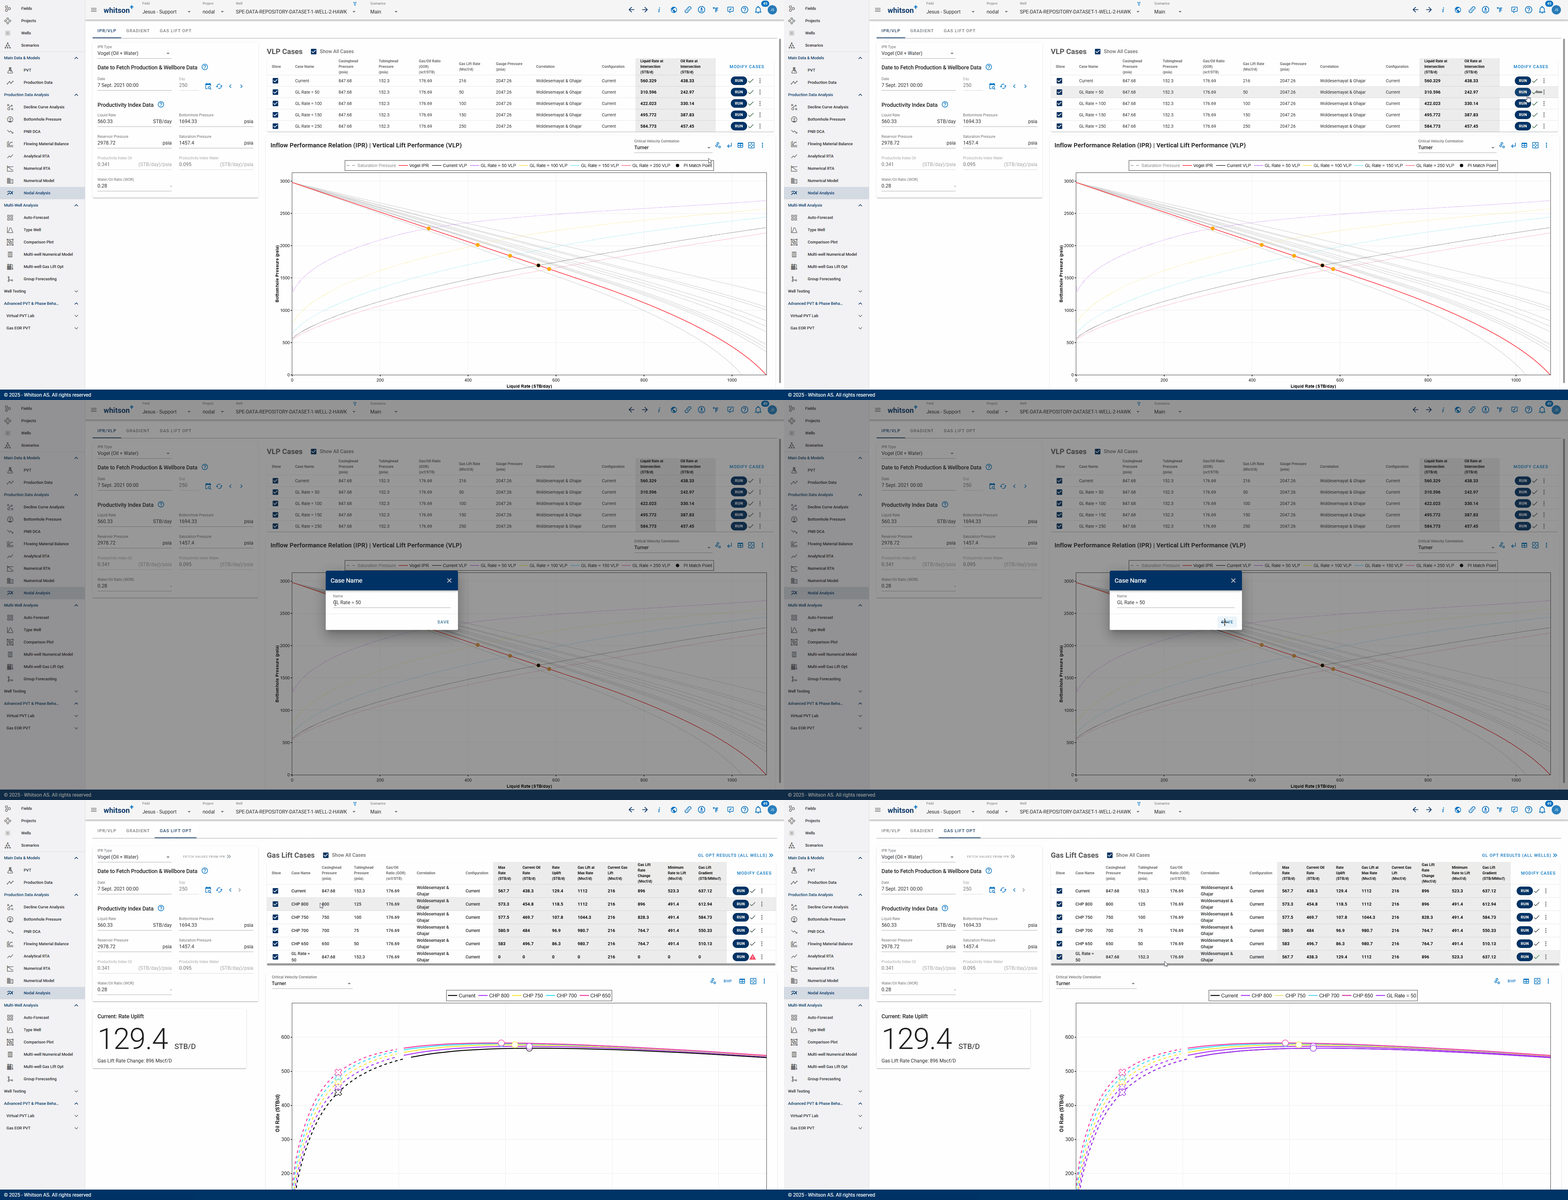
You can export your VLP cases individually to the GLO tab by clicking the three dots, selecting the desired destination, and entering a name for the case.
6.5. Plot BHP
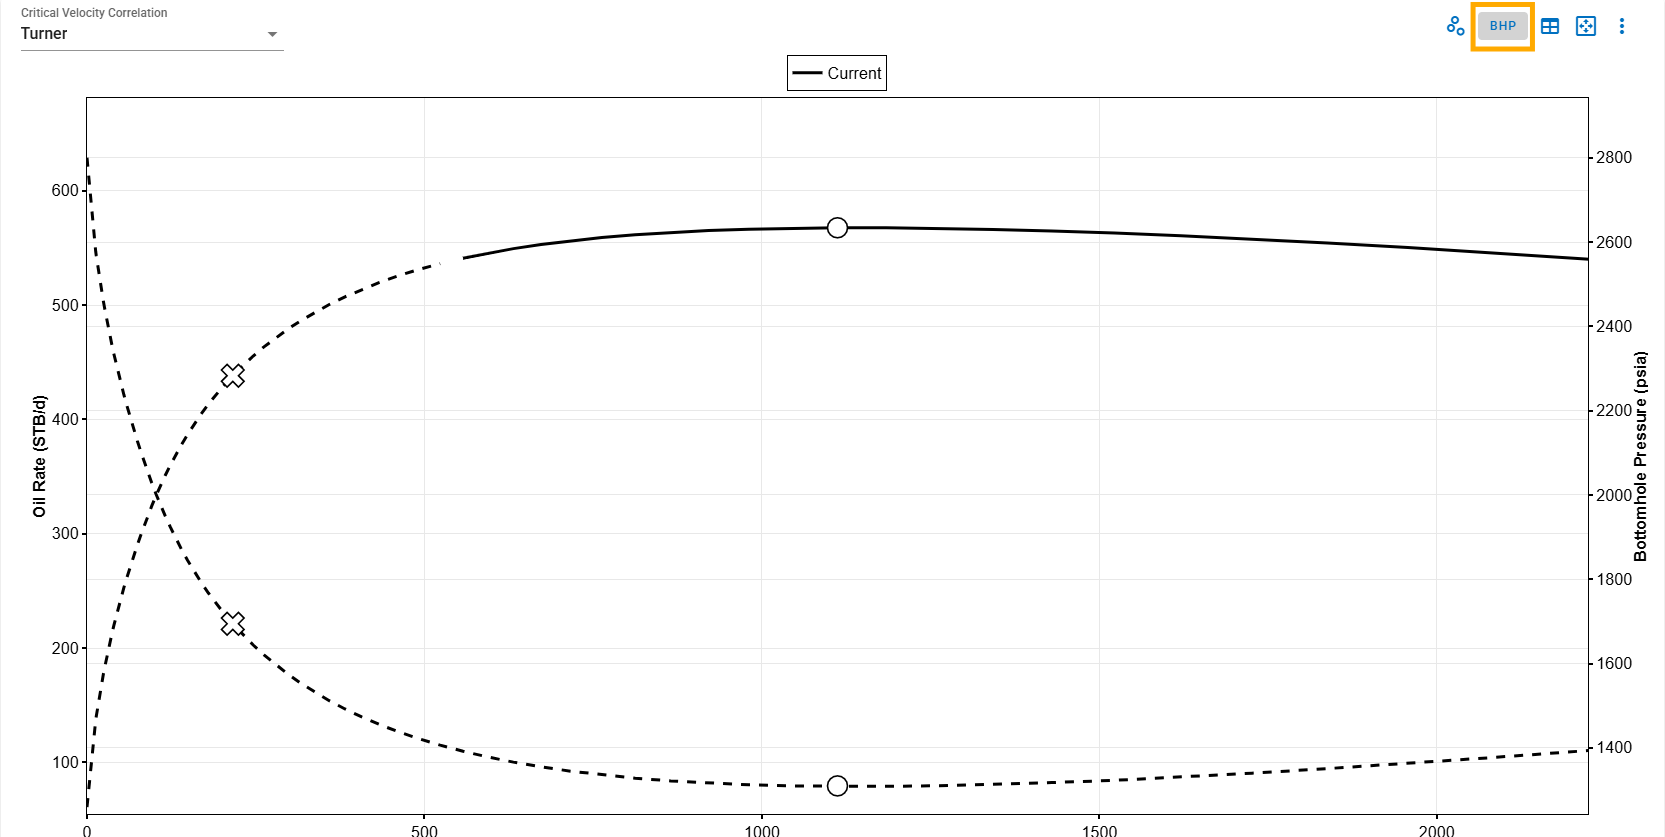
You can also plot the BHP on the oil rate vs. gas lift injection rate graph to identify liquid loading conditions. This helps visualize how BHP responds to varying gas injection rates, indicating the minimum injection required to lift liquids and showing the maximum achievable oil rate along with the corresponding bottomhole pressure.