Decline Curve Analysis
Decline curve analysis (DCA) for all three flowing phases can be performed within whitson+, both automatically and manually. User-friendly, "drag-and-drop" curve-fitting functionality is also provided.
1. Input
The inputs for this analysis are:
- DCA parameters (\(b\), \(a_i\), \(q_i\))
- Start (day or month)
- Total production period (years)
- Limited Decline Rate (\(a_{lim}\) or \(d_{lim}\)). More info here.
The user can decide whether to lock in the start day and the DCA parameters, or if these should change freely during the curve fitting.
2. Theory
2.1 Fundamentals
The classical equation that provides that basis for this module is
where
\(q_i\) = initial flow rate
\(a_i\) = nominal decline rate at time zero
\(b\) = rate exponent
\(q(t)\) = flow rate at time t
Equation 1 is a three-parameter performance-matching equation. When the \(b\) is equal to zero, the flow rate decline is exponential, when \(b\) is 1, the rate decline is called harmonic, and when b is between zero and one, the rate decline is hyperbolic. Some general guidelines for b and how it relates to the description of the reservoir are provided below.
| \(b\) value | Context |
|---|---|
| 0 | Single-phase oil, or single-phase gas at high pressure |
| 0.1-0.4 | Solution gas drive |
| 0.4-0.5 | Single-phase gas flow |
| 0.5-1 | Layered reservoirs |
| >1 | Infinite acting flow |
2.1.1 Exponential Decline (b=0)
where \(N(\infty)\) is the ultimate cumulative production.
2.1.2 Hyperbolic Decline (0 < b < 1)
2.1.3 Harmonic Decline (b = 1)
2.1.4 Beyond Hyperbolic (b > 1)
2.2 DCA Summary
| Type | Decline Rate | Producing Rate, q | Elapsed Time, t | Cum. Production, \(Q_{t}\) |
|---|---|---|---|---|
| Exponential | \(a_t = ln(\frac{q_i}{q_t})/t\) | \(q_ie^{-a_it}\) | \(ln(\frac{q_i}{q_t})/a_i\) | \(\frac{q_i-q_t}{a_i}\) |
| Hyperbolic | \(\frac{a_i}{a_t} = (\frac{q_i}{q_t})^b\) | \(q_i(1+ba_it)^{-1/b}\) | \(\frac{(q_i/q_t)^b-1}{ba_i}\) | \(\frac{q_i}{a_i(1-b)}(1-\frac{q_t}{q_i}^{1-b})\) |
| Harmonic | \(\frac{a_i}{a_t} = \frac{q_i}{q_t}\) | \(q_i(1+a_it)^{-1}\) | \(\frac{(q_i-q_t)}{a_iq_t}\) | \(\frac{q_i}{a_i}ln(\frac{q_i}{q_t})\) |
2.3 Effective Decline
Nominal annual decline rate is denoted "a". The effective annual decline rate is denoted "d", with units %/yr. There are two common ways the industry converts annual decline into effective decline,
"Effective Hyperbolic Decline" aka "Secant Effective"
"Effective Exponential Decline aka "Tangent Effective"
Both of these properties can be converted back by the following equations
Note
These numbers are mere conversions to and from \(a_{i}\) and should yield identical results irrespective of what is chosen. For most folks, it's mainly the matter of preference when it comes to what is communicated in terms of the final results.
The symbols for the different terms can vary somewhat from software to software, so here is a little overview for some handpicked softwares.
| Name | whitson+ | ARIES | Harmony | PhdWin / SPEE | Val Nav |
|---|---|---|---|---|---|
| Initial nominal annual decline rate | \(a_{i}\) | \(A_{i}\) | \(a_{i}\) | \(D_{i}\) | Di (nom) |
| Initial effective hyperbolic annual decline rate | \(d_{hyp}\) | \(D_{b}\) | \(d_{sec}\) | \(D_{esi}\) | Di (eff. sec) |
| Initial effective exponential annual decline rate | \(d_{exp}\) | \(D_{h}\) | \(d_{tan}\) | \(D_{ei}\) | Di (eff. tan) |
| Rate exponent | b | n | b | b | Ni |
More information about this is provided by SPEE.
2.4 Limited / Modified Decline
The limited decline rate begins when the hyperbolic decline curve transitions into an exponential decline curve at a specified limiting effective decline rate, \(d_{lim}\). The limiting effective decline rate is converted to a limiting nominal decline rate, \(a_{lim}\), and the following equations are applied:
When \(d_{tan}\) > \(d_{lim}\):
when \(d_{tan}\) <= \(d_{lim}\):
where
3. Decline Curve Analysis in whitson+
3.1 Autofit
The autofit algorithm finds the last segment of the data that is consecutively (continously) non-zero, and fits the DCA parameters to this part of the data only. A single or set of zero rates in the data is typically associated with a shut-in, in which re-initialization of the DCA fit should be performed.
3.1.1 Residual Function
The fitting routine uses the following residual function in the least square routine.
where \(r_i\) is the residual at time \(i\), \(w_i\) is the weight factor of time \(i\), \(t_0\) is the time index and q is the actual rate.
3.1.2 Default Bounds
| Parameter | Lower Bound | Higher Bound | Unit |
|---|---|---|---|
| \(q_i\) | 40% of max observed q | 20% higher than max observed q | volume unit / time |
| \(a_i\) | 0 | 10 | /yr |
| \(b\) | 0 | 2 | - |
3.1.3 Adjusting default autofit bounds on DCA parameters
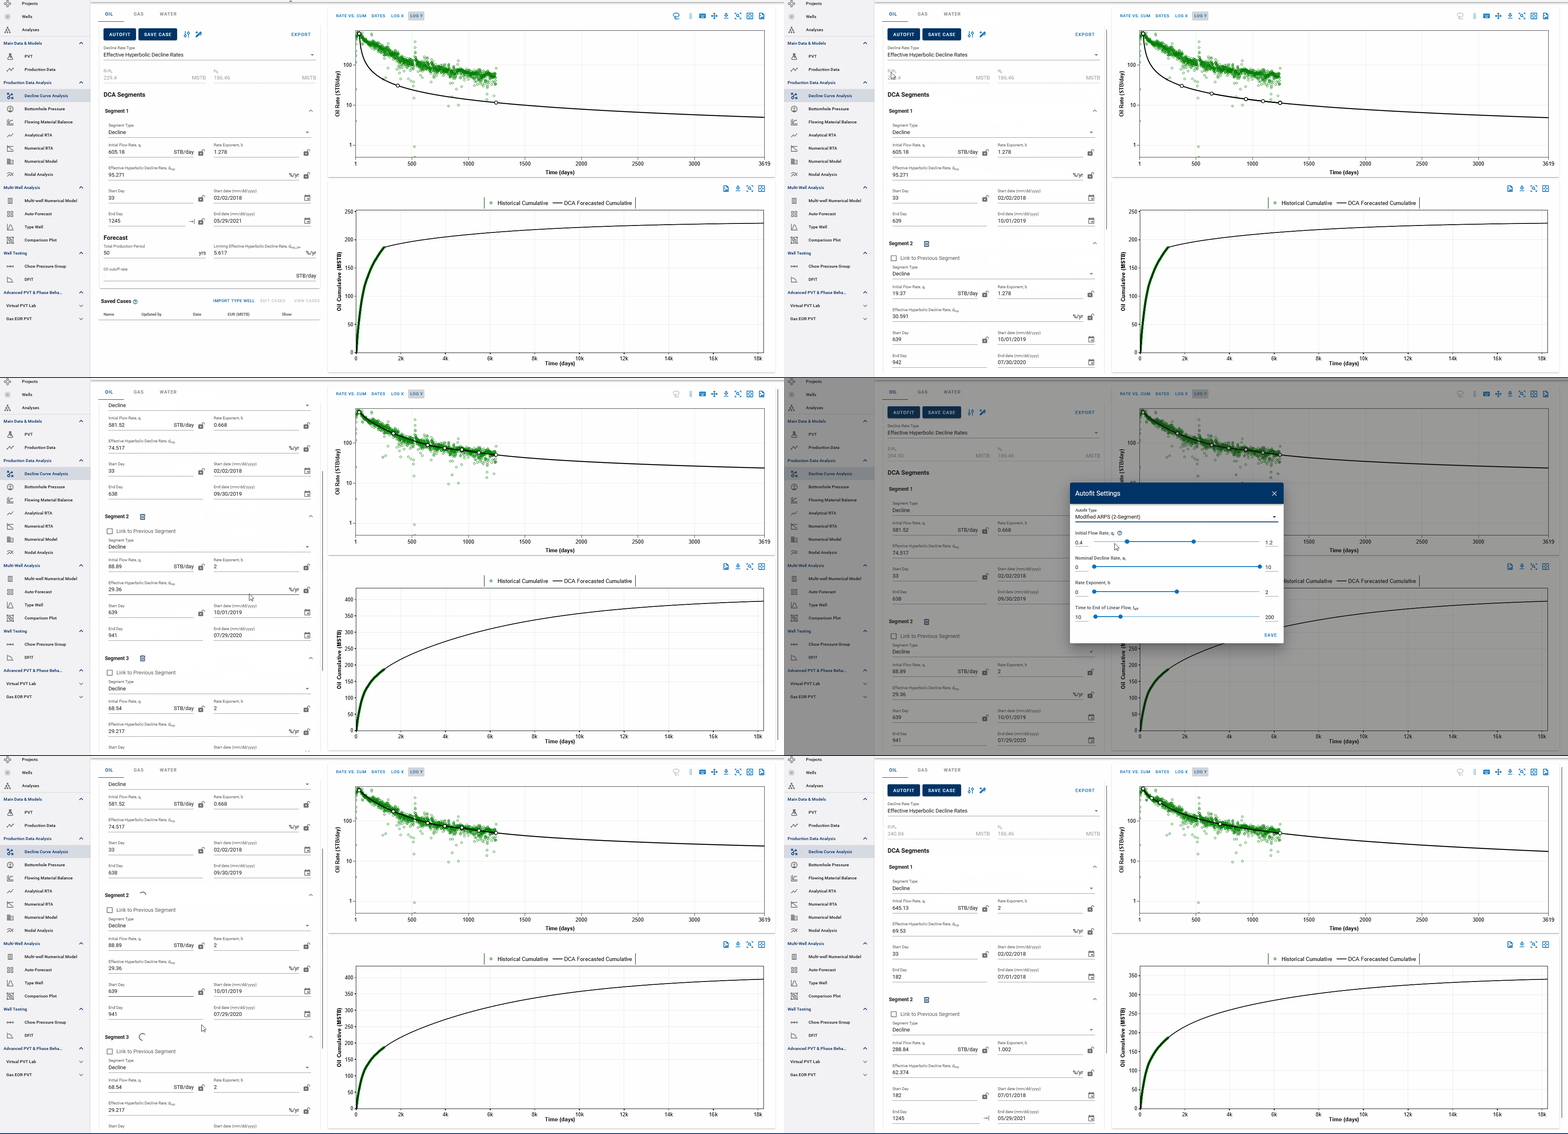
Fig. 1: Autofitting DCA Segments and Autofit settings
You can also adjust the settings for autofitting decline to your data by adjusting the decline parameter ranges and specifying the autofit type as the default Arps decline or the modified Arps decline.
The autofit function will automatically add a second decline segment (if it does not exist) and fit 2 segments to the data if the autofit type is modified Arps decline.
You can choose to autofit some or all of your segments at once and control the autofit on each segment by using the locks on decline parameters.
3.1.4 Weighting factors
By default, all days have a weighting factor of 1, except from the days when q = 0, in which the weighting factor is 0.
3.2 DCA on physics-based forecasts
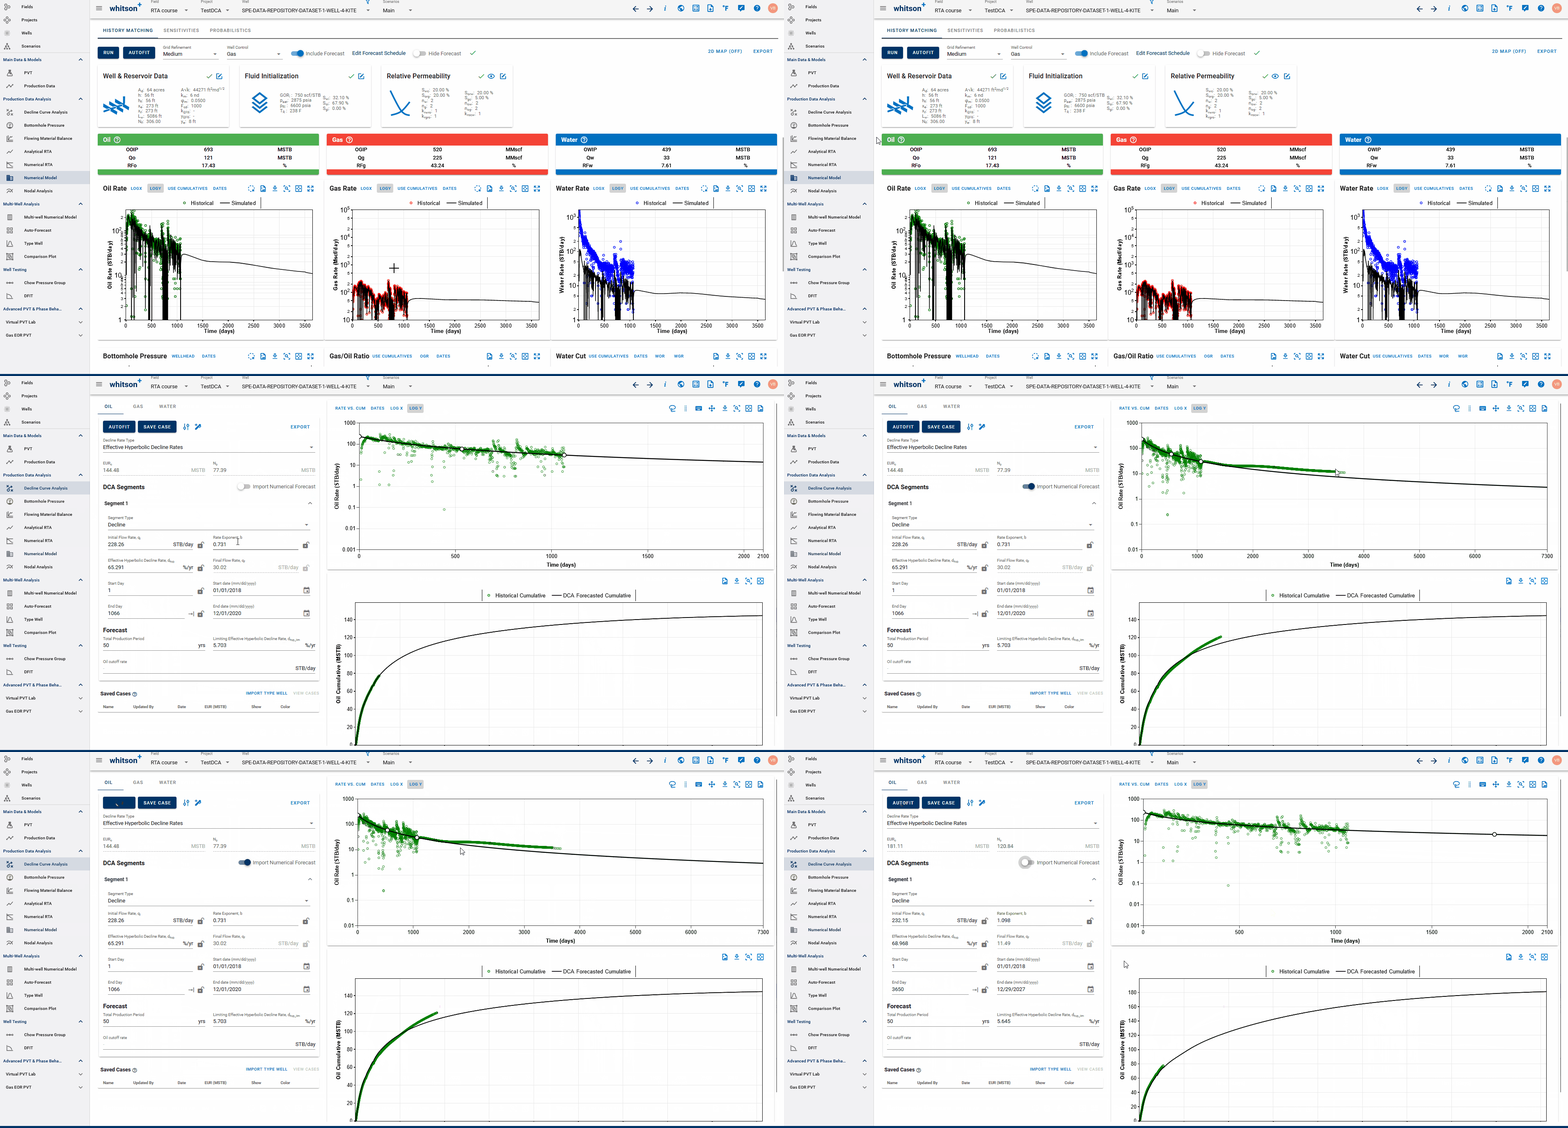
Fig. 2: Fitting DCA to simulated history match from Numerical Model
If a physics based forecast has been established for this well via the numerical model, an option to include this data will appear as a toggle, shown above.
You can build a physics based forecast in the Numerical Model feature, where the reservoir simulation can history match the well and generate a forecast based on the numerical model set up. Once the model is simulated with a forecast included, you can bring this history match into the DCA feature to be able to build declines for the simulated history match data with the simulated forecast included, thus, allowing for physics-based, DCA forecasts.
3.3 General tips
3.3.1 Adding multiple decline segments
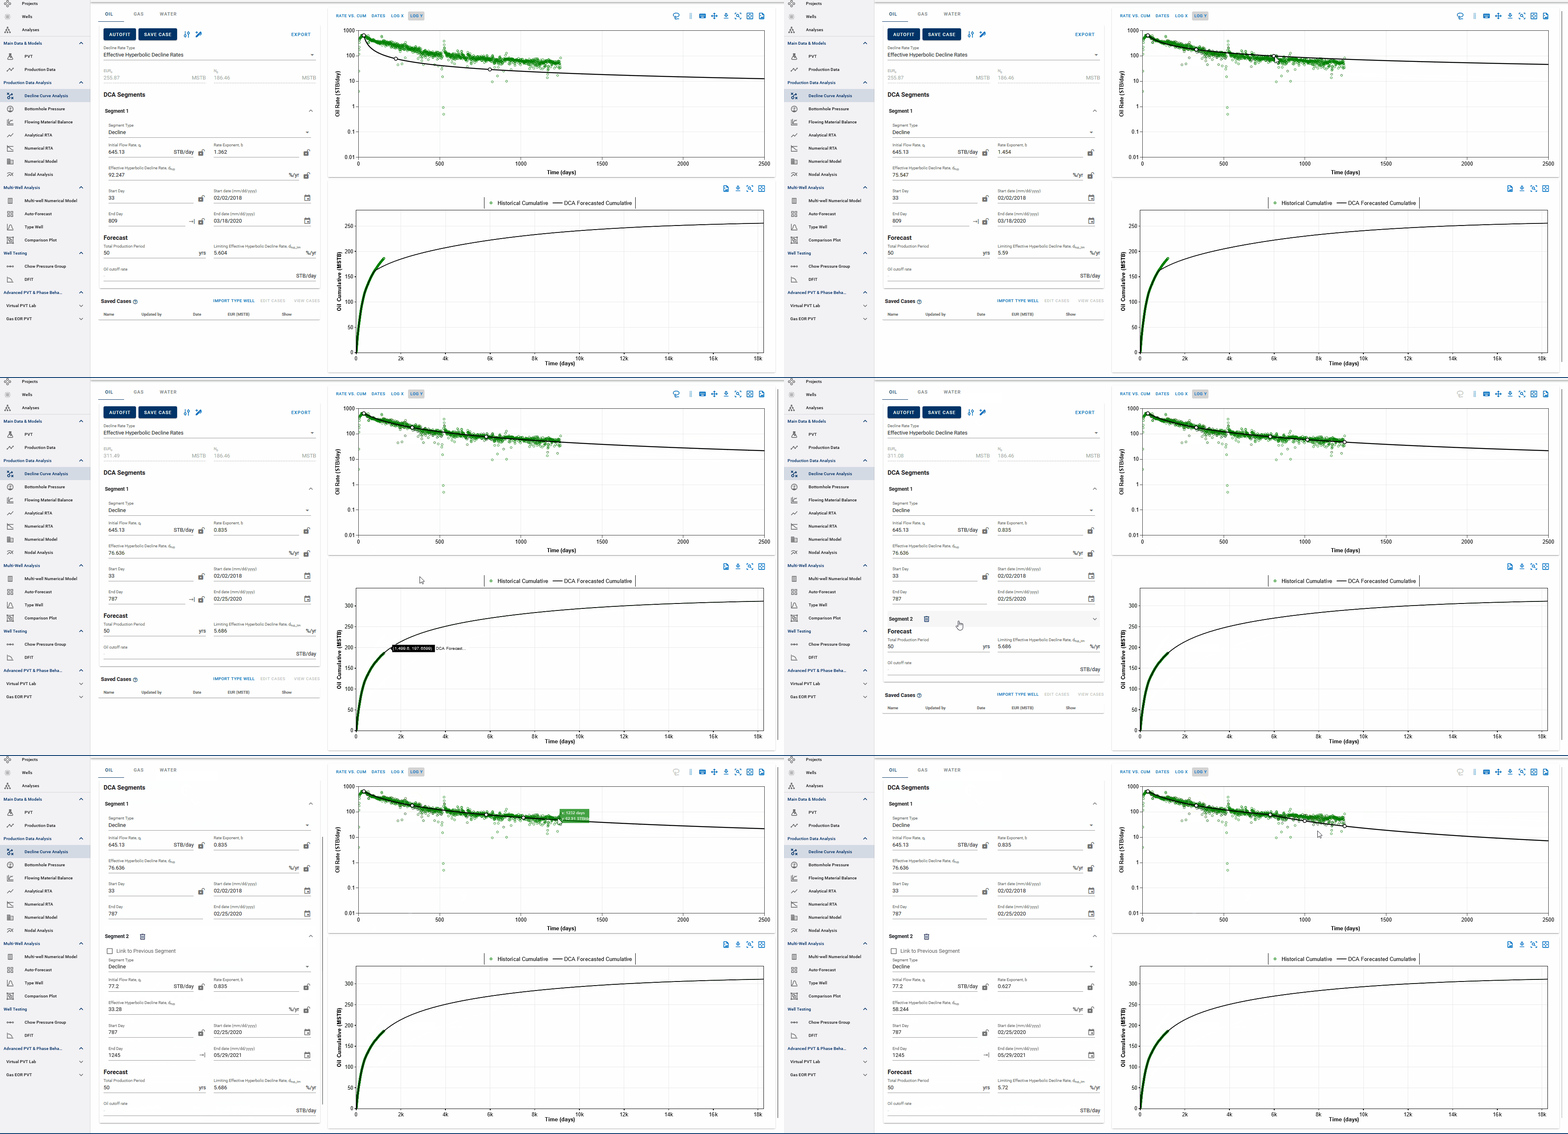
Fig. 3: Adding DCA Segments
You can add multiple Arps decline segments to the data, as proposed by the Modified Arps decline method (2 segments). Each of these segments can be linear incline, constant or the Arps decline type segments - controlled individually by directly entering the inputs, or adjusting the curve on the plot itself to auto-compute the decline parameters for each of them.
Adding multiple segments may be useful to model particular flow regimes, constant rate well control or refrac analysis.
3.3.3 Where does the DCA forecast append to historical data?
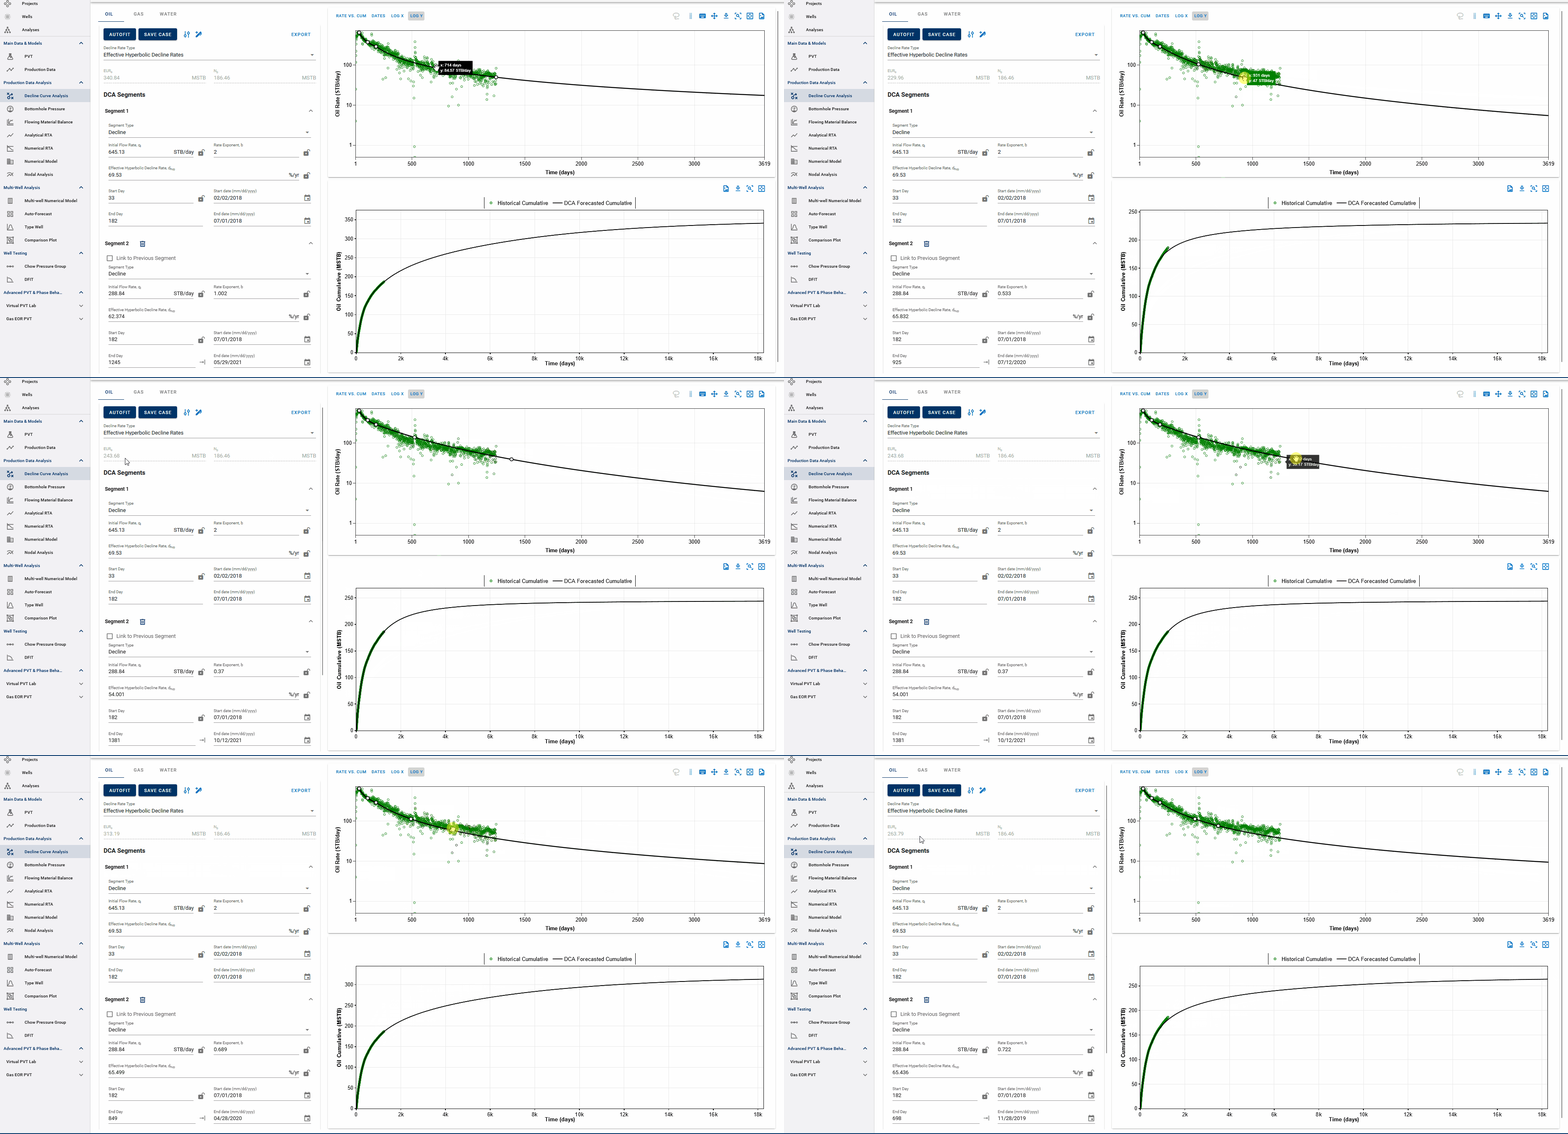
Fig. 4: Appending forecasts to data and EUR calculation
The end date of the forecast on the DCA plot dictates where the forecast is appended to historical data. The forecast is appended to the last producing day of the well history, or the end date of the last segment itself, whichever is earlier, and the EUR is calculated accordingly.
End date beyond the last producing day will include all the production history, followed by the forecast to calculate EUR and any end date before the last producing day will append the forecast from the set end date and follow the forecast from this point, discarding the production data after this end date.
EUR shown in the top-left box should be exactly equal to the EUR (black line) plotted on the cumulative plot (bottom) at the end of the total production period.
3.3.4 Rate-time decline vs Rate-cum decline
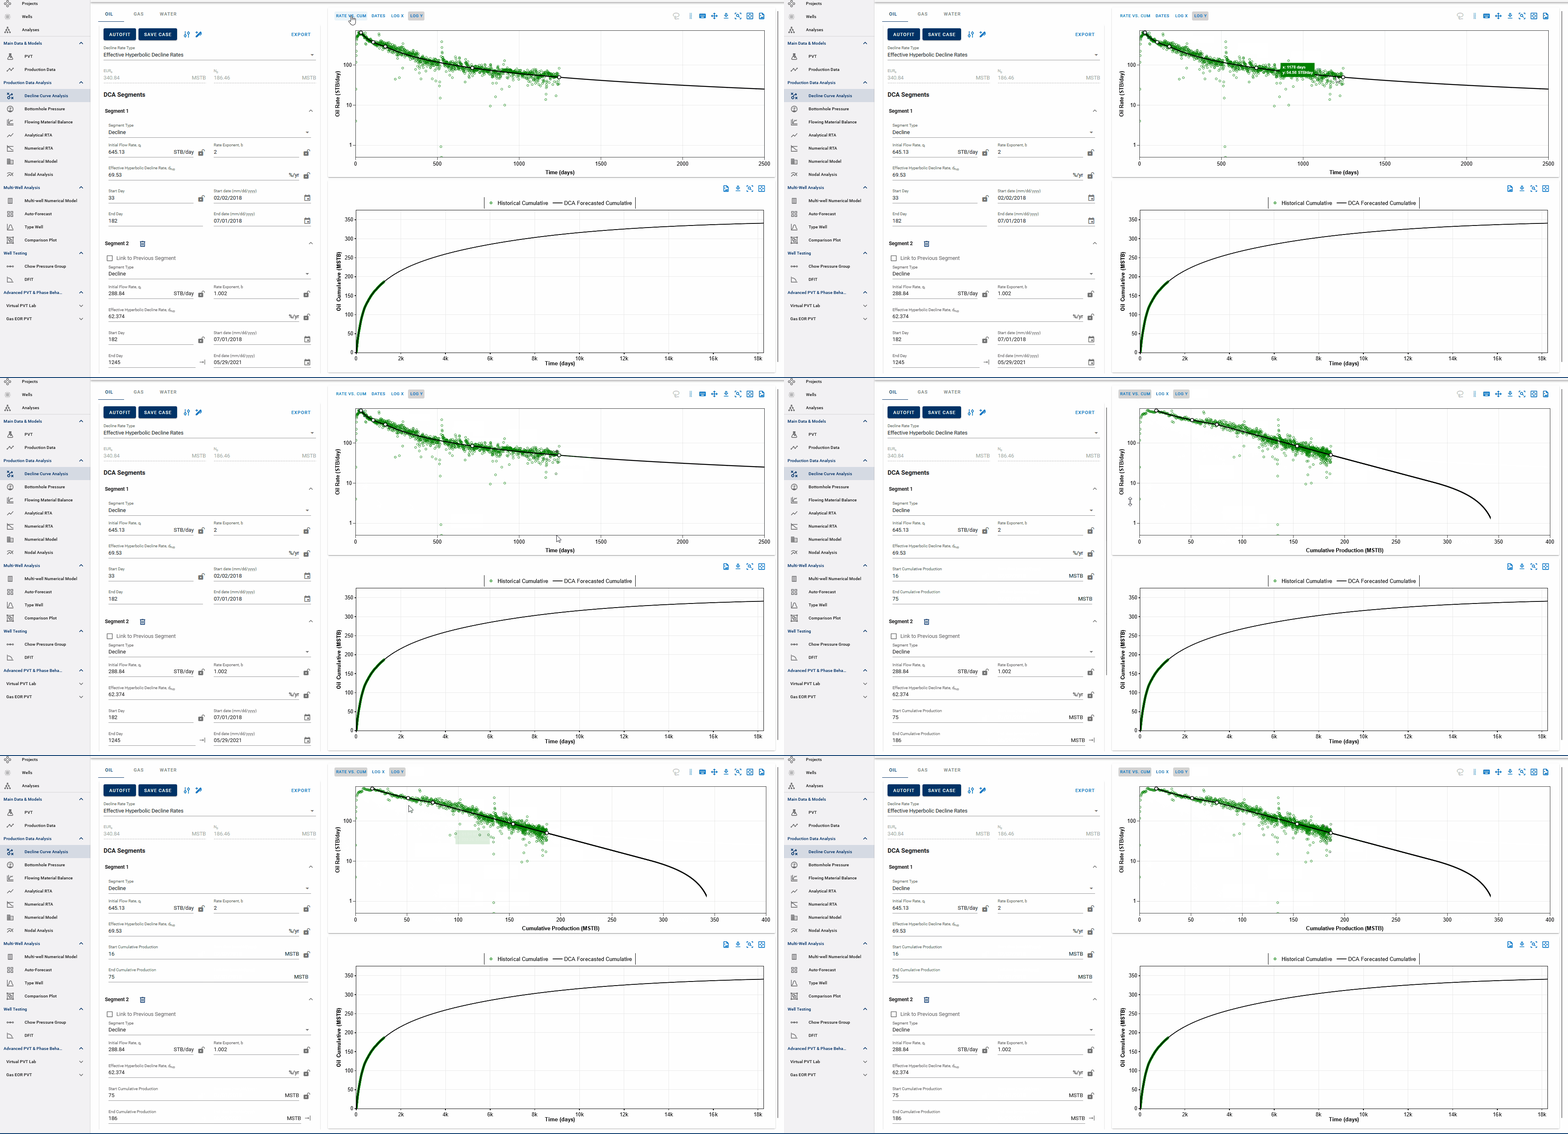
Fig. 5: DCA segments on rate vs cumulative plots
You can observe the decline fit in rate vs time space or rate vs cumulative space on the same plot (top).
3.3.5 Linking decline segments
You can use the 'Link to Previous Segment' checkbox for each segment to link the previous segment to this one in time for continuity. We are working on linking other elements from the previous segment (like the rates and declines at the end of the previous segment) to add to this functionality.
3.3.6 Saving the DCA fit
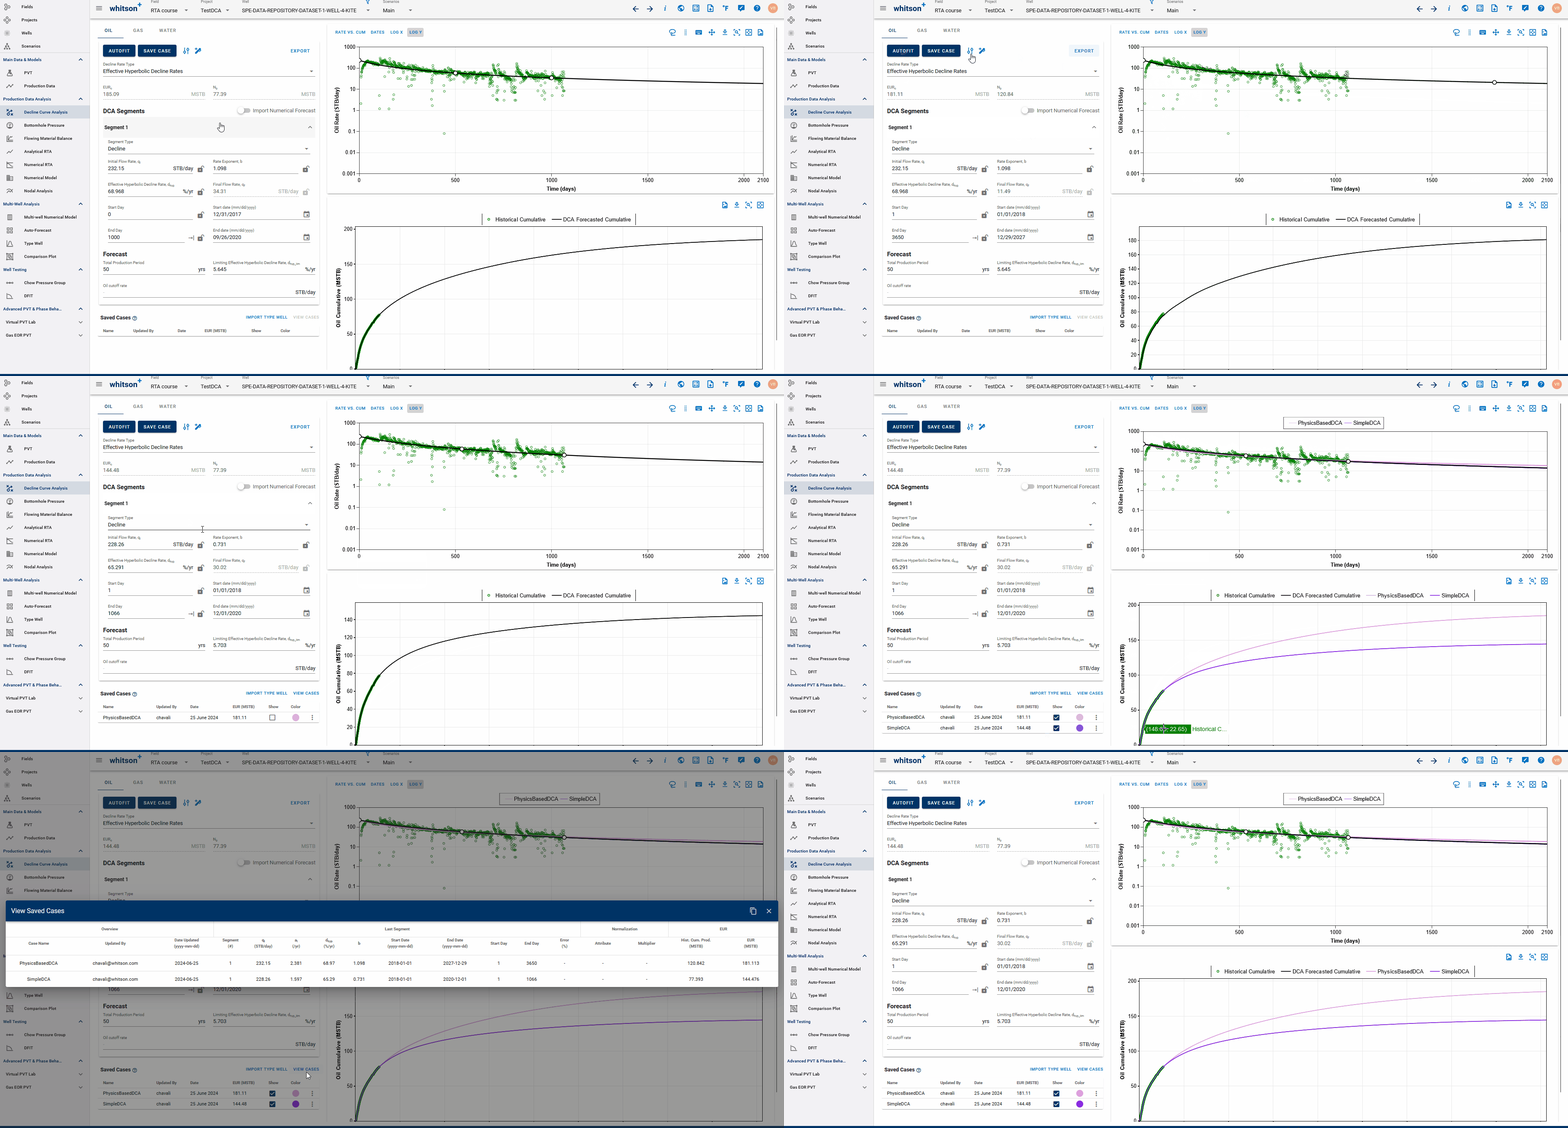
Fig. 6: Saving the DCA fit
You can save the current DCA fit as a saved case by using the SAVE CASE button. You can then adjust the fit as you'd like because you can always use the saved case as a checkpoint.
You can overlay the saved cases in the plot by checking the box under "Show" column for each saved case.
You can also reload the DCA parameters (and hence the fit) at any time by using the 'Load Case' option for available for every saved case by clicking the three vertical dots.
Saving a case with a name that already exists in the list of saved cases will prompt you to confirm that you want to rewrite the saved case with the new data to prevent duplicate cases.
Importing saved Type well DCA case to DCA and saved cases from DCA into Type well
If you fit DCA to the type well, made from a set of wells in the Type Well feature (DCA tab), and save that, you can import this saved DCA fit for the type well into list of saved cases in this feature. This lets you plot your type well decline over the actual well decline to compare.
Alternatively, if you saved the DCA fits for all the wells with the same name, you can import this into the Type well feature such that each of the individual well declines set up with that name is appended to the respective wells and the Type well is built for historical data + individual well declines. This removes the need for forecasting the constructed type well with DCA.
6. Export
The results from the DCA feature can to be exported to:
- Aries
- ComboCurve
- Excel
- PHDWin
- Mosaic
- Val Nav
Note that the forecast in the export starts from the end of the uploaded historical data. Hence the best fit qi and decline parameters has to be recalculated for the end of history (as they change with time), as outlined here.
6.1 Export to Aries
The following outlines how the ARIES export works with a specific example.
For an example well with these parameters.
- qi = 51.7334 STB/d
- d_lim = 5.0000 %/yr
- b = 1.2
- d_hyp = 43.7863 %/yr
- Cutoff rate = 3.0 STB/d
- forecast_time = 582.3934 months
There will be 4 cases, these are all shown assuming the parameters are for the oil phase, but the logic is equally applicable for gas and water.
Case 1 - well reaches cutoff rate before d_lim, the ARIES export would look like this:
We have a single line which shows qi, cutoff rate, b and d
DEMOWELL
PRODUCTION
CUMS 80.1645 0.4055 780.3532
START 03/2022
OIL 51.7334 3.0 B/D X MOS B/1.2 43.7863
Case 2 - well reaches cutoff rate after d_lim but before end of forecast period, the ARIES export would look like this:
We have two lines as before, only difference being that instead of putting the period of 582 months (or any number for the case), we put X
DEMOWELL
PRODUCTION
CUMS 80.1645 0.4055 780.3532
START 03/2022
OIL 51.7334 X B/D 5.0000 EXP B/1.2 43.7863
" X 3.0 B/D X MOS EXP 5.0000
Case 3 - well reaches d_lim and does not reach cut off rate until the end of the forecast period, the ARIES export would look like this:
DEMOWELL
PRODUCTION
CUMS 80.1645 0.4055 780.3532
START 03/2022
OIL 51.7334 X B/D 5.0000 EXP B/1.2 43.7863
" X X B/D 582.3934 MOS EXP 5.0000
Case 4 - d_hyp is lower than d_lim:
In addition to these 3 main cases, there is an exceptional case in which d_hyp < d_lim, for example if in the case presented above d_hyp was 3.2561 %/yr instead 43.7863 %/yr. The export to Aries would look as follows.
Case 4a - If cutoff rate is not reached before end of forecast period:
DEMOWELL
PRODUCTION
CUMS 80.1645 0.4055 780.3532
START 03/2022
OIL 51.7334 X B/D 582.3934 MOS EXP 3.2561
Case 4b - If cutoff rate is reached before end of forecast period:
DEMOWELL
PRODUCTION
CUMS 80.1645 0.4055 780.3532
START 03/2022
OIL 51.7334 3.0 B/D X MOS EXP 3.2561