Compositional Gradient
Compositional gradient is a phenomena that occures when the chemical potential and gravitational potential equilibrate, resulting in a variation in the composition versus depth. The general trend of the compositional gradient is that the heavier components tend to increase with depth while the lightest component (e.g. methane) tends to decrease versus depth. Variations in temperature can play a significant impact, but the most common computational approaches to solving for the compositional gradient are isothermal, meaning that they assume constant temperature.
The goal of calculating the compositional gradient is (1) to describe the composition versus depth, and (2) for estimating the gas-oil contact. This information is essential for estimating reservers and initilizing reservoir simulation models (either compositional or black-oil models). For compositional models a table of compositions versus depth are given to the reservoir model, while for a black-oil model these compositions are used to calculate the GOR versus depth.
There is a long list of reasons why a reservoir might have a compositional gradient or not. A summary of these reasons was given by Høier and Whitson in 2000. The reasons are summarized below:
-
Gravity segregates the heaviest components towards the bottom and lighter components like methane towards the top.
-
Thermal diffusion (generally) segregates the lightest components towards the bottom – i.e. towards higher temperatures – and heavier components towards the top (towards lower temperatures).
-
Thermally-induced convection creating “mixed” fluid systems with more-or-less constant compositions, often associated with very-high permeability or fractured reservoirs.
-
Migration and “equilibrium” distribution of hydrocarbons is not yet complete, as the times required for diffusion over distances of kilometers may be many 10’s of millions of years.
-
Dynamic flux of an aquifer passing by and contacting only part of a laterally-extensive reservoir may create a sink for the continuos depletion of lighter components such as methane.
-
Asphaltene precipitation (a) during migration may lead to a distribution of varying oil types in the high- and lowpermeability layers in a reservoir; and (b) in the lower parts of a reservoir (“tar mats”) caused by non-ideal thermodynamics and gravitational forces.
-
Varying distribution of hydrocarbon types (e.g.paraffin and aromatic) within the heptanes-plus fractions.
-
Biodegredation varying laterally and with depth may cause significant variation in, for example, H2S content and API gravity.
-
Regional (10-100’s km) methane concentrations that may lead to neighboring fields having varying degrees of gas saturation, e.g. neighboring fault blocks which vary from saturated gas-oil systems to strongly-undersaturated oils.
-
Multiple source rocks migrating differentially into different layers and geological units.
The necessary data to compute the isothemal compositional gradient is an EOS model, an average temperature (\(T\)) and a seed composition (\(z_i\)). As discussed, there are a multitude of reasons for not having a compositional gradient, so measured data is essential to determining the degree of compositional grading. Measured compositions versus depth and / or GOR and density versus depth for at least two points are needed to indicate whether or not there is a compositional gradient. A damping factor (i.e. a value between 0 and 1 that indicated no gradient; a dapening factor of 0, or a full compositional gradient; a dapening factor of 1) can be tuned to measured data to estimate the GOC.
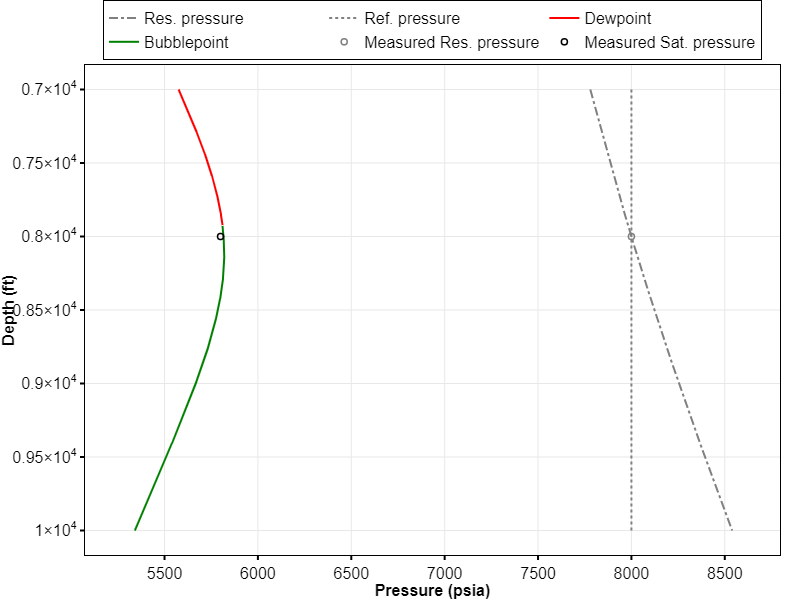
There are two possible types of GOC; (a) a saturated GOC, and (b) an undersaturated GOC. The saturated GOC is the most common and is shown in Figure 1.
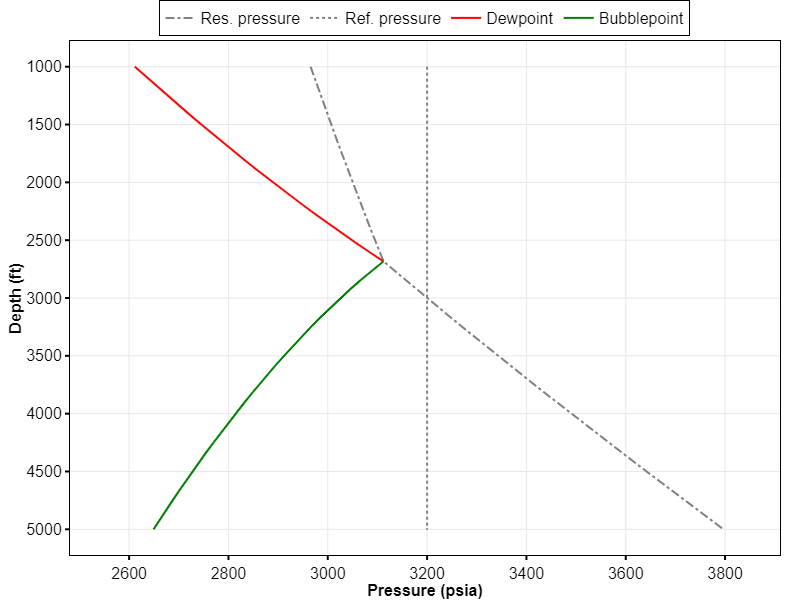
The less common undersaturated GOC does not pass through the phase envelope, and therefore has a smooth transition from gas-like to liquid like without the reservoir pressure and the saturation pressure intersecting. An example is shown in Figure 2.