Production Data - Stock Tank Rates
1. Rate Input
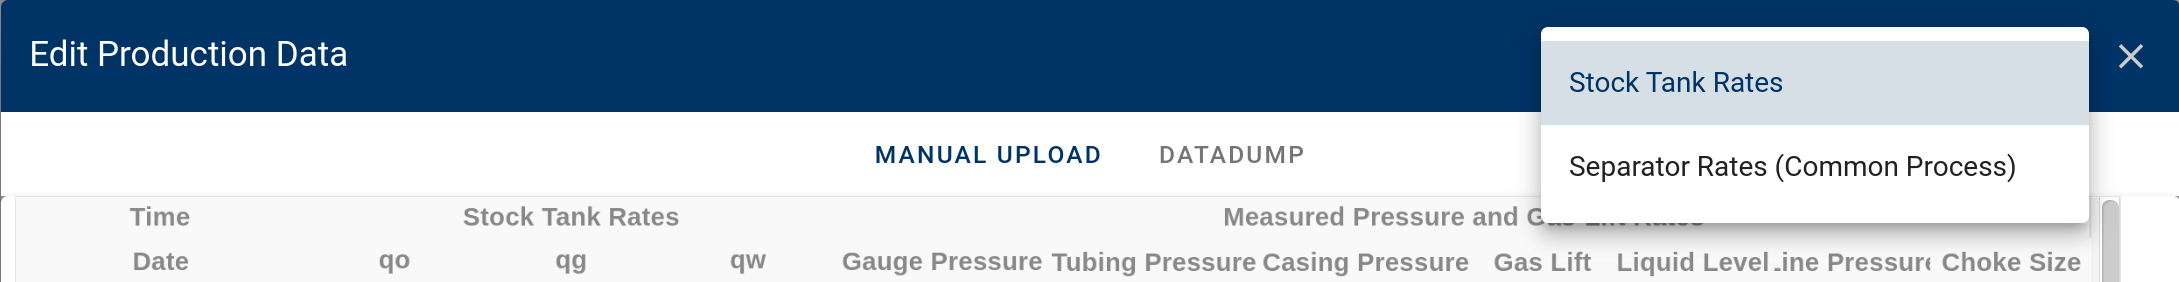
1.1. Options
The user can choose to input either stock tank or separator rates. This page goes through the details of working with stock tank rates. If you are working with separator rates, follow the information here instead Production Data - Separator Rates.
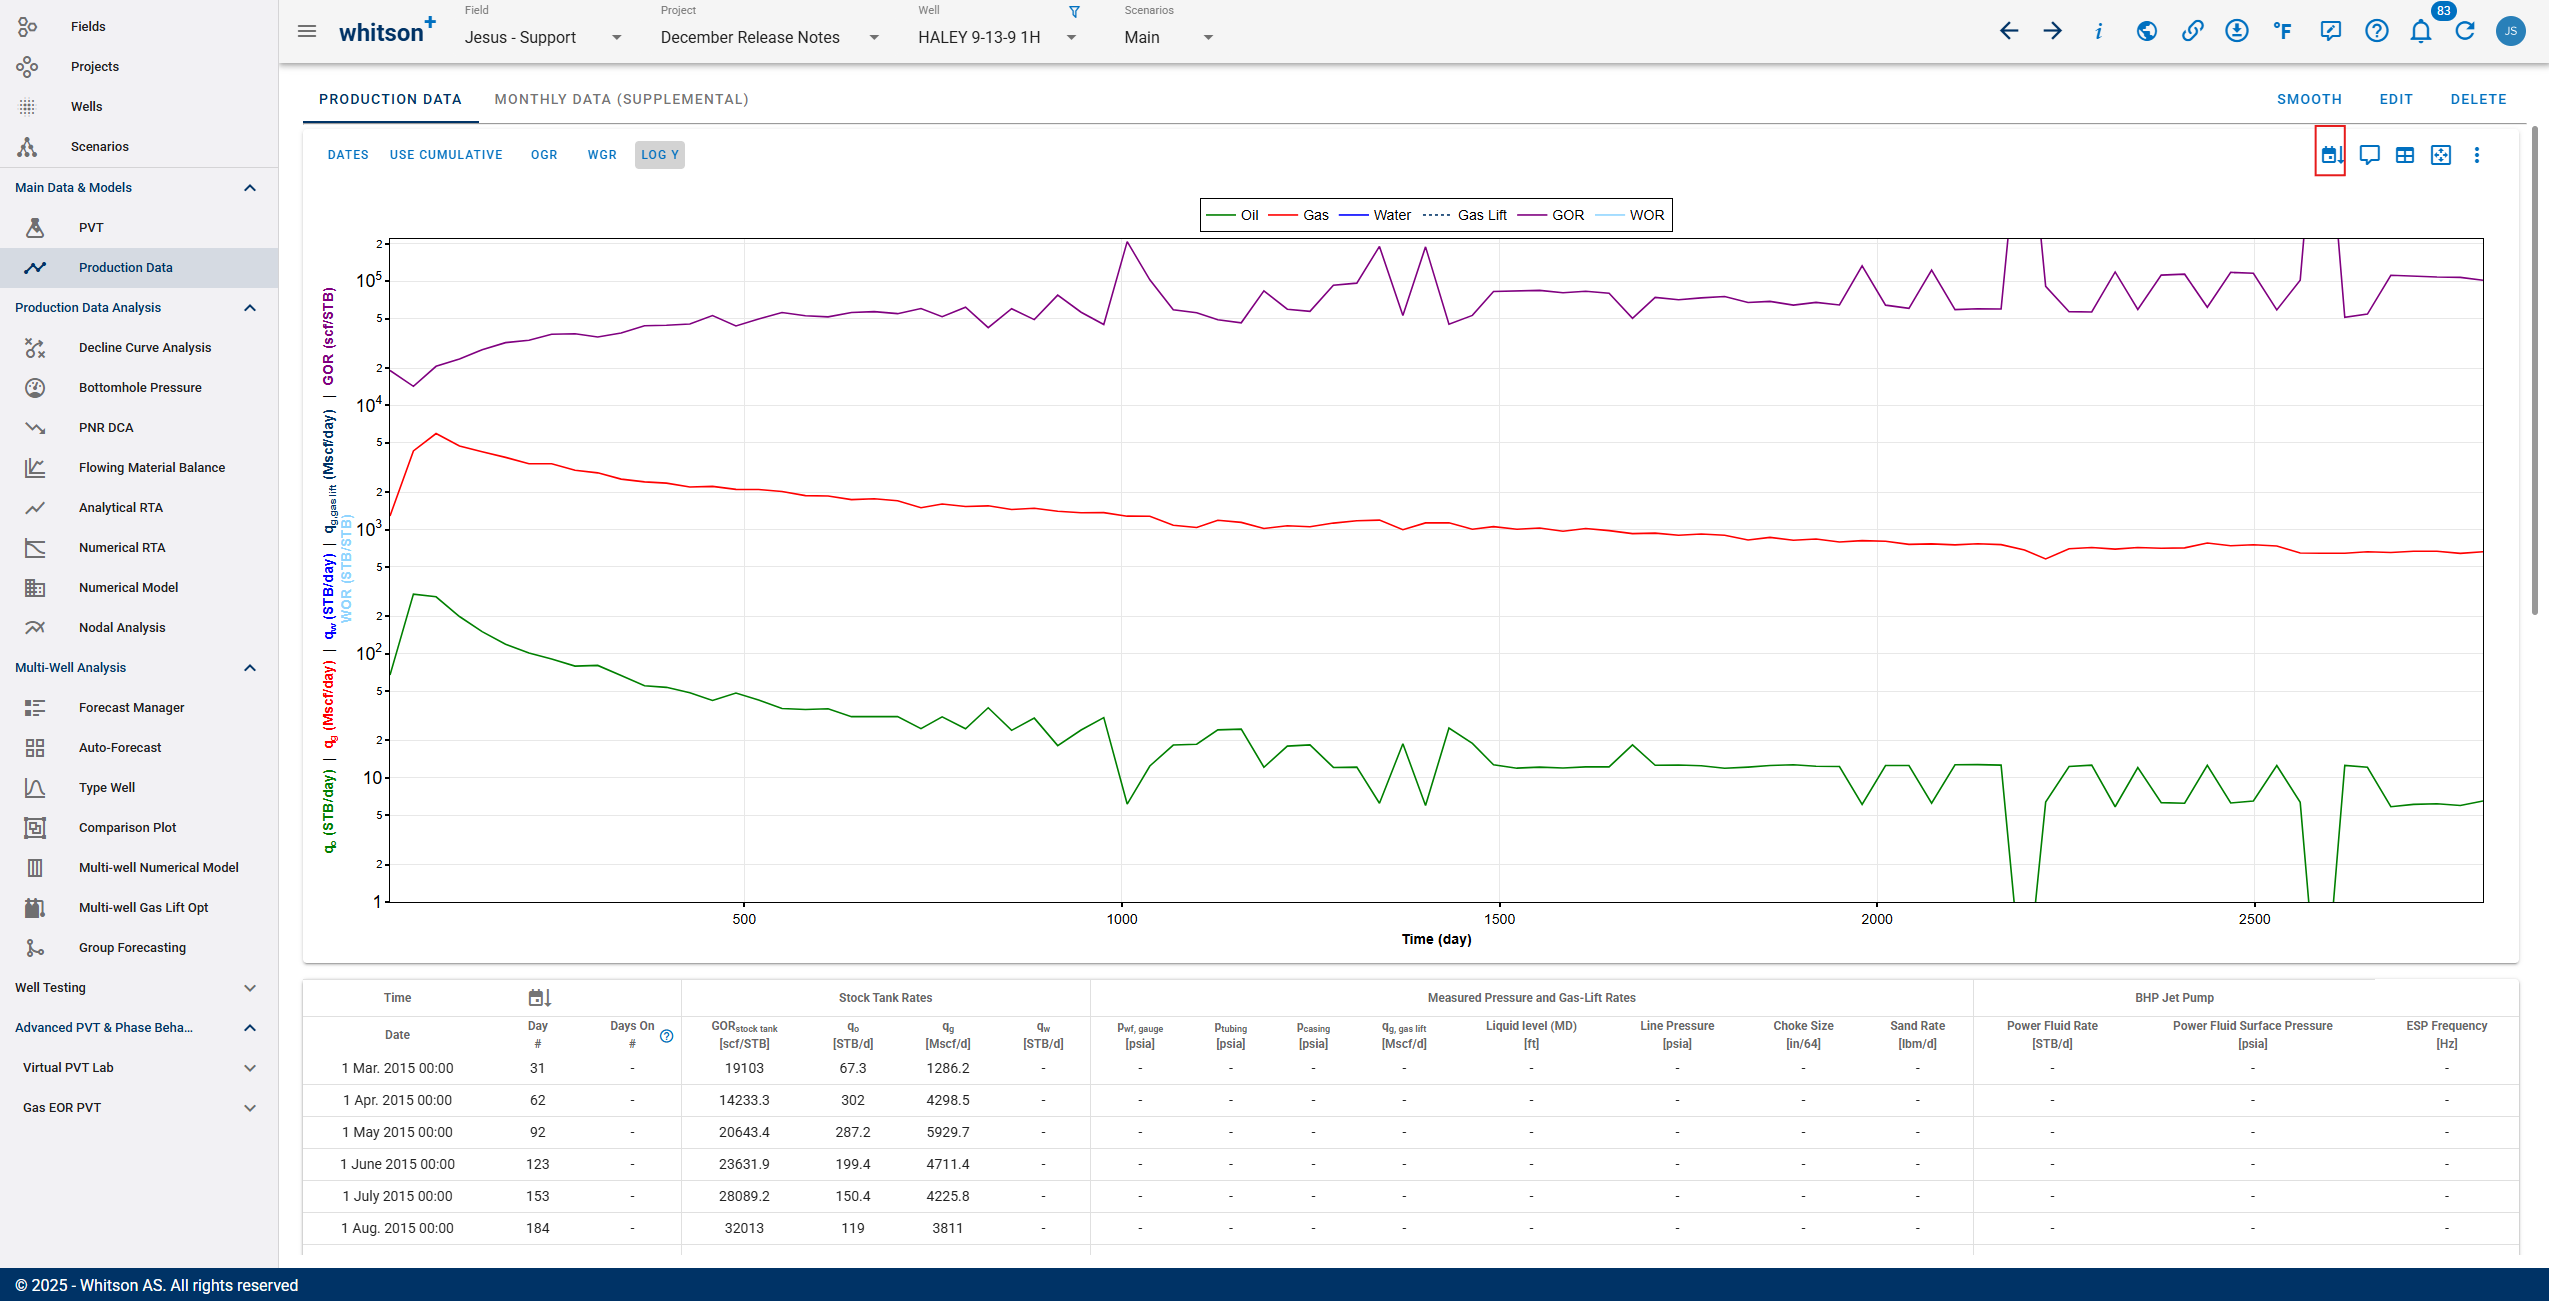
1.2. Overview
The software allows manual editing of all stock tank rate inputs. Users can view, enter, or adjust daily measurements directly in the platform.
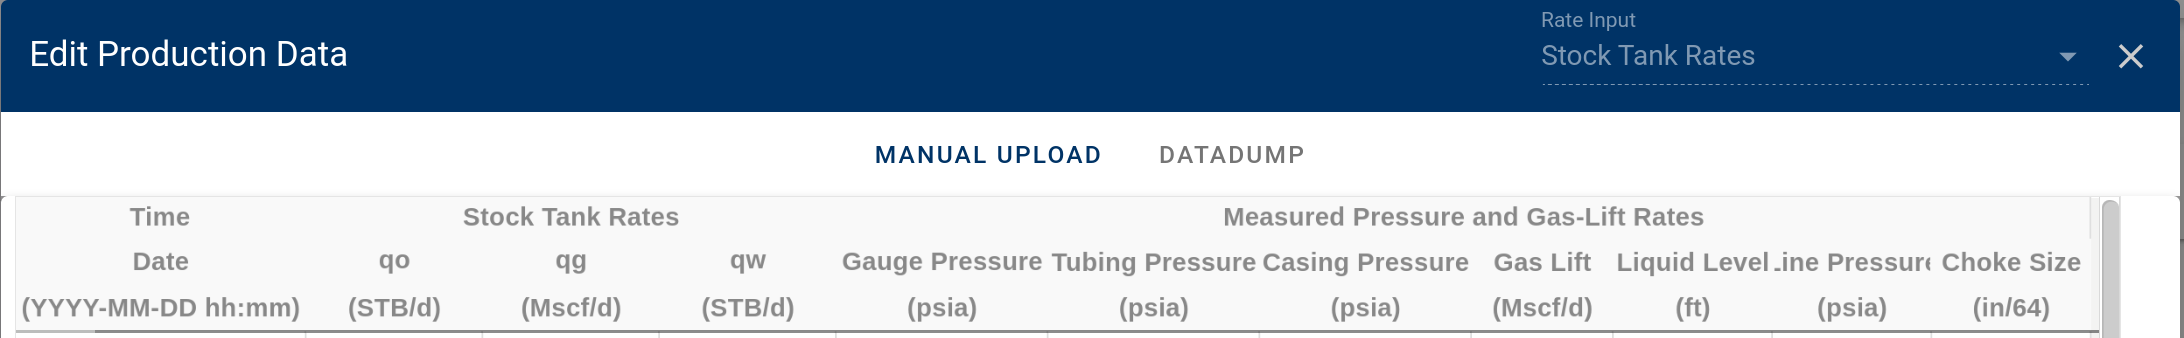
1. Date: production data recording date.
2. Stock Tank Rates: contains oil, gas, and water production rates measured at stock tank conditions.
| Parameter | Description | Field Units | SI/Metric Units | Field/Metric (Canada) Units | SI/Metric (Canada) Units | Argentina Units |
|---|---|---|---|---|---|---|
| qo | Oil production rate at the stock tank | STB/d | Sm/d | STB/d | Sm/d | Sm/d |
| qg | Gas production rate at the surface | Mscf/d | 10Sm/d | Mscf/d | 10Sm/d | 10Sm/d |
| qw | Water production rate at the stock tank | STB/d | Sm/d | STB/d | Sm/d | Sm/d |
Table 1. Stock tank rate units available in whitson+.
3. Measured Pressure and Gas-Lift Rates: contains measured pressure data and artificial-lift operating parameters used for production surveillance and analysis.
| Parameter | Description | Field Units | SI/Metric Units | Field/Metric (Canada) Units | SI/Metric (Canada) Units | Argentina Units |
|---|---|---|---|---|---|---|
| Gauge Pressure | Measured downhole gauge pressure | psia | bara | kPaa | kPaa | kg/cm |
| Tubing Pressure | Tubing pressure | psia | bara | kPaa | kPaa | kg/cm |
| Casing Pressure | Casing pressure | psia | bara | kPaa | kPaa | kg/cm |
| Gas Lift | Gas lift injection rate if using gas lift | Mscf/d | 10Sm/d | Mscf/d | Mscf/d | 10Sm/d |
| Liquid Level MD | Measured depth of liquid level if using rod pump | ft | m | m | m | m |
| Line Pressure | Line pressure | psia | bara | kPaa | kPaa | kg/cm |
| Choke Size | Choke size | 1/64 inch | mm | mm | mm | mm |
Table 2. Measured pressure and gas-lift rate units available in whitson+.
4. BHP Jet Pump: contains jet-pump operating data and associated measurements used for bottomhole pressure estimation and jet-pump performance analysis.
| Parameter | Description | Field Units | SI/Metric Units | Field/Metric (Canada) Units | SI/Metric (Canada) Units | Argentina Units |
|---|---|---|---|---|---|---|
| Sand Rate | Estimated mass rate of produced solids at surface or from a sand probe | lbm/d | kg/d | lbm/d | kg/d | kg/d |
| Power Fluid Rate | Injection rate of jet-pump power fluid supplied to the well | STB/d | Sm/d | STB/d | Sm/d | Sm/d |
| Power Fluid Pressure | Surface pressure of the jet-pump power-fluid supply line | psia | bara | kPaa | kPaa | kg/cm |
Table 3. BHP jet pump units available in whitson+.
5. Other Surface and Timing Fields: contains additional operational, timing, and metadata fields used for production tracking and quality control.
| Parameter | Description | Field Units | SI/Metric Units | Field/Metric (Canada) Units | SI/Metric (Canada) Units | Argentina Units |
|---|---|---|---|---|---|---|
| Surface Pressure | Measured wellhead or flowline pressure for the producing stream | psia | bara | kPaa | kPaa | kg/cm |
| ESP Frequency | ESP motor operating frequency; proxy for pump speed | Hz | Hz | Hz | Hz | Hz |
| Days On | Number of producing days within the reporting interval | days | days | days | days | days |
| Comment | Free-text notes for the row (e.g., shut-in reason, choke change, test details, data quality) | text | text | text | text | text |
Table 4. Other surface and timing fields available in whitson+.
Days On Usage in Production Data Workflow
The use of “Days On” depends on the type of production rate being entered into the system.
1 Calendar Rates
When using calendar rates, the reported rate is assumed to already represent production over the full timestep. In this case, “Days On” should not be populated and can be left blank. The cumulative production is calculated directly from the provided rate.
- Producing Rates
When using producing rates, “Days On” represents the fraction of the timestep during which the well was actively producing.
For example:
If a well produced for half a day, “Days On” = 0.5. In this case, the rate must be consistent with the specified “Days On” value so that:
2. How to Upload
There are three ways to upload production data into whitson+:
- Manual upload: copy and paste production data into the frontend.
- Datadump pre-populated flat files (Excel or CSV).
- API/database connection for automatic data upload (updated every day).
Remember
- Upload only one available data type. If you only have stock tank rates available, upload stock tank rates only, and vice versa.
- If you don't want to calculate bottomhole pressures, you can skip the columns related to that calculation (tubing pressure, casing pressure, gas lift rates, etc.).
When the well is on gas lift, are gas rates netted or gross (including gas lift rates)?
The entered gas rates in the production data editor are assumed to be netted out
The reason we do this is because the gas rate is used everywhere in the system, including the numerical model, flowing material balance, and RTA, where gas lift is not part of the calculation (i.e. not part of the reservoir flow).
In the BHP calculations, to get the total gas that is flowing inside the wellbore, we just do the calculation in the background as follows:
3. Manual Upload
3.1. Upload data
- Click on the "UPLOAD" option to upload data.
- Copy and paste into the relevant columns.
- Click "SAVE" to the lower left when finished.
- All the steps are shown in the gif above.
Remember
- The functionality is very similar to Excel, so a good rule of thumb is: "If it works in Excel, it works here."
- Just upload the data you have available, skip the rest.
3.2. Edit data
- Click on the "EDIT" option to edit data.
- Modify the cells you would like to change.
- Click "SAVE" to the lower left when finished.
- All the steps are shown in the gif above.
3.2.1. Add more data points (rows)
- Go to the data below the last row.
- Paste the new rows of data.
- Click "SAVE" to the lower left when finished.
- Remember that the date (time) value must be unique, and increase in order.
- All the steps are shown in the gif above.
3.2.2. Delete data (rows)
- Select the row of data you'd like to remove.
- Right click with the mouse and select "Delete Selected Row" or use the backspace key on your keyboard to remove row(s).
You can also use the keyboard shortcut: CTRL + SHIFT + right arrow + down arrow to select multiple rows. - Click on "SAVE".
- All the steps are shown in the gif above.
3.3. Smooth data
If the input production data is noisy, it can be smoothed graphically. See details in the video above.
3.4. Visual Delete
- Click "DELETE" and then "Visual delete".
- Drag the black dotted line to the desired start date. Data before that line will be deleted.
- Drag the blue dotted line to the desired end date. Data after that line will be deleted.
- Click "Delete Selected Data" to save changes.
- All the steps are shown in the gif above.
4. Graph Options
The production data editor includes several graph options that help you QC data, understand operational changes, and quickly move between the plot and the table.
4.1. Show wellbore configuration dates
Enable Show Wellbore Configuration Dates to visualize when and how new wellbore configurations changed over time.
- When enabled, vertical indicators are added to the plot at each configuration start date.
- This makes it easy to confirm where changes such as tubing updates, artificial lift changes, or other configuration edits begin affecting calculations.
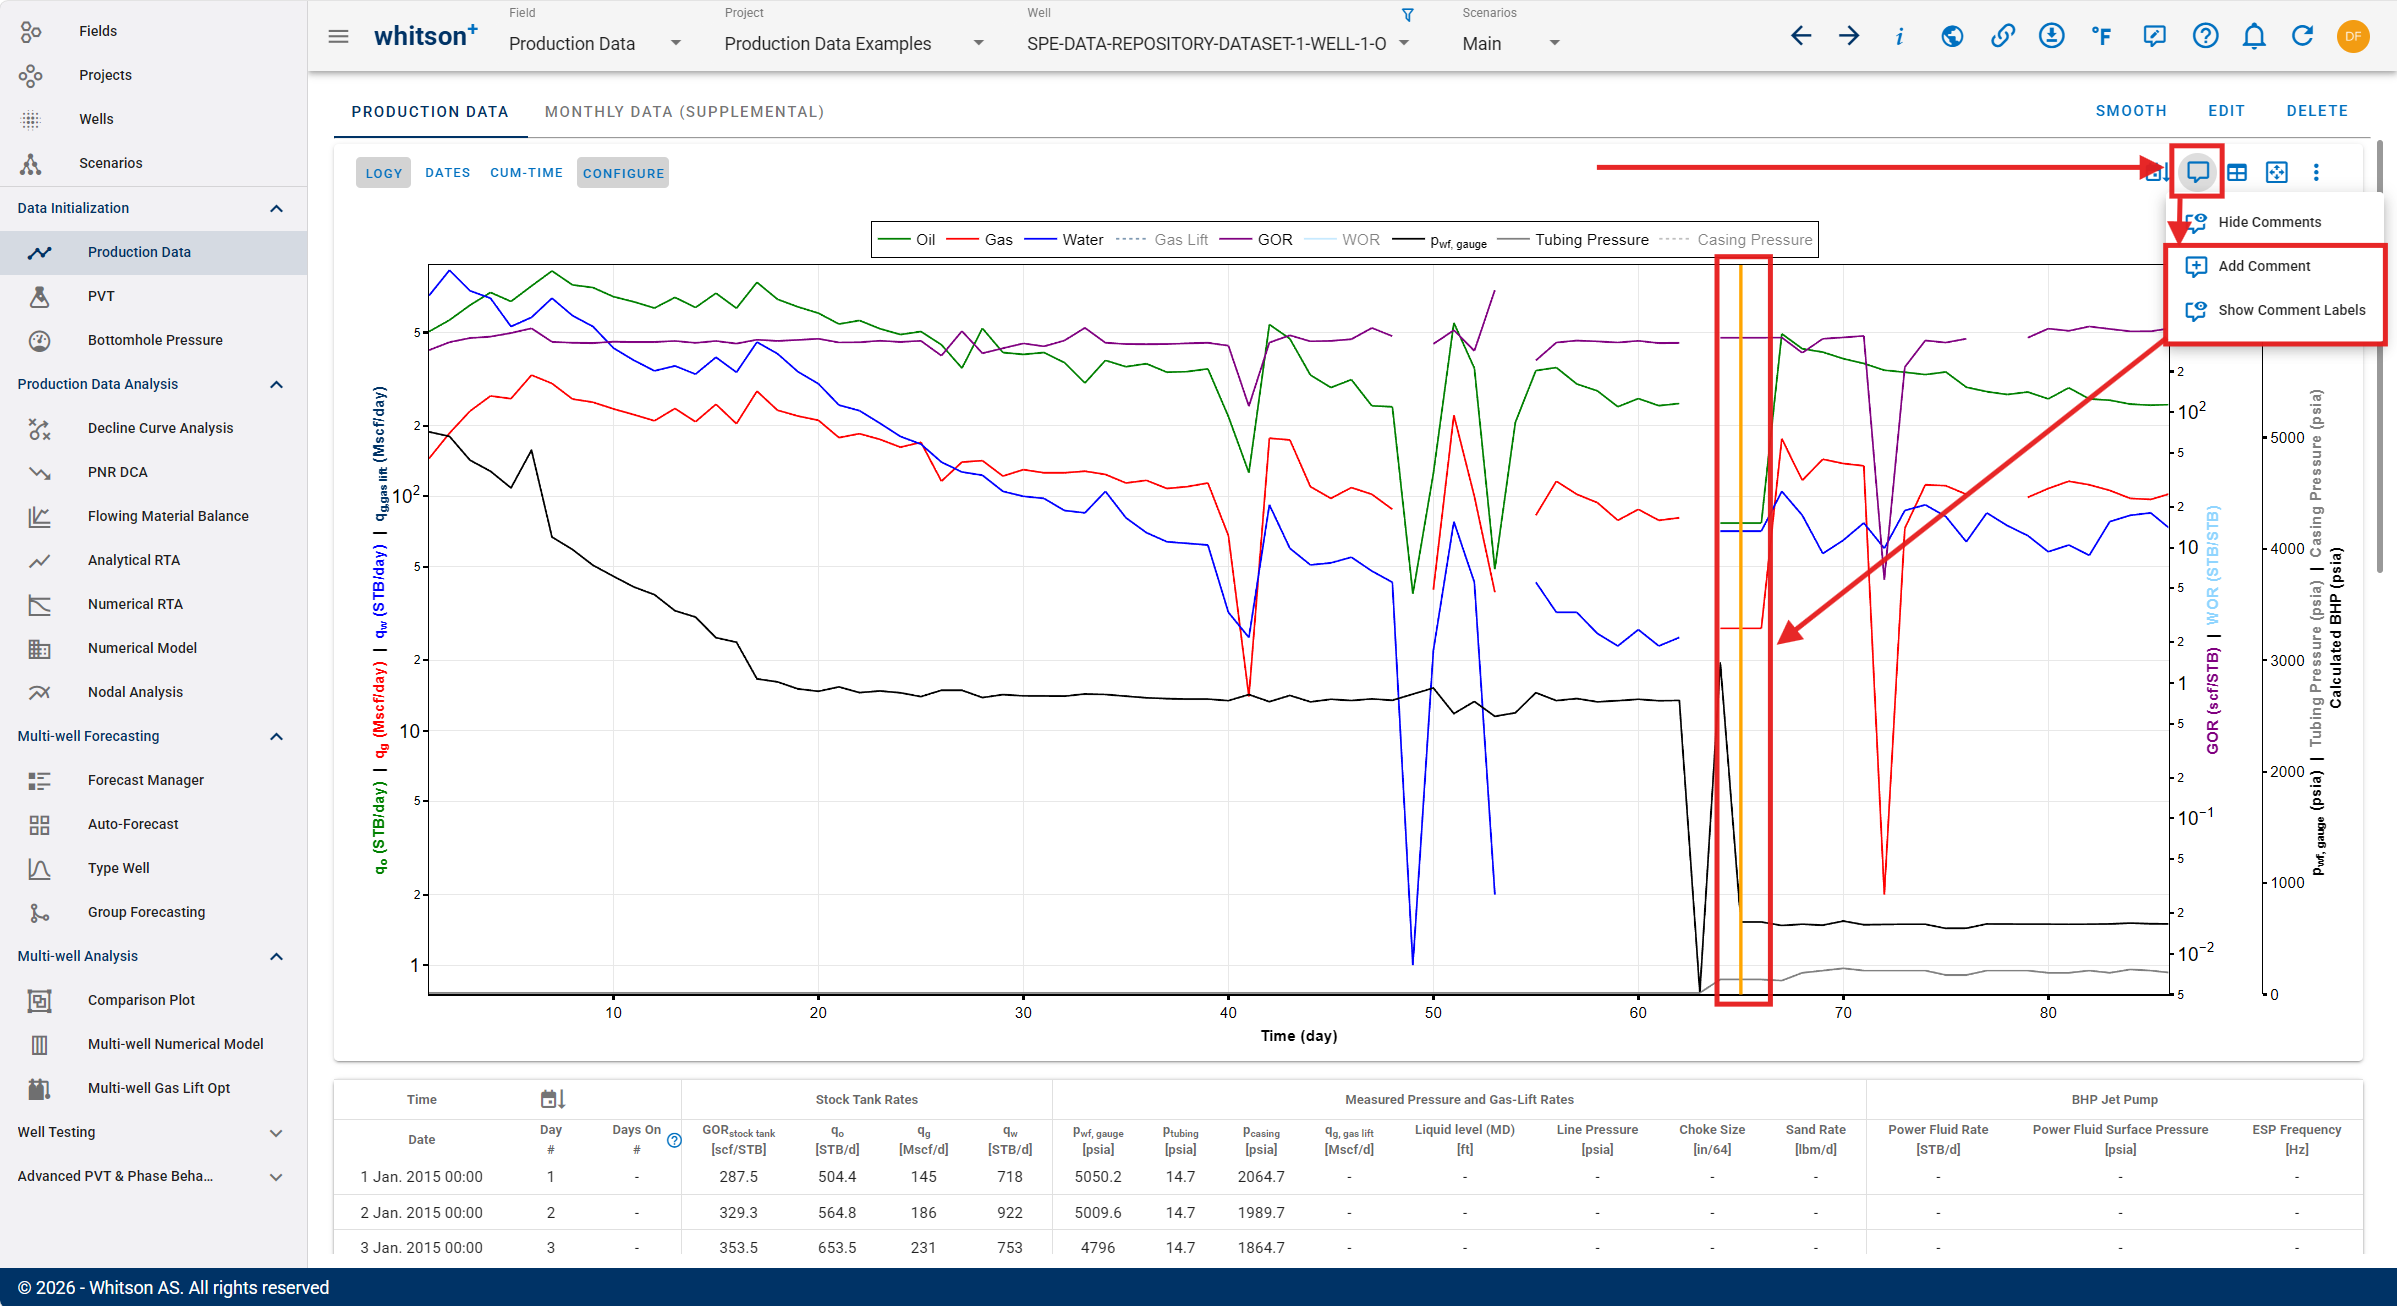
4.2. Production comments
Use the Production Comments function to display row comments directly on the plot.
- When enabled, the plot shows comment markers at the corresponding dates.
- Hover over a marker to read the comment, and use it to confirm events like shut-ins, choke changes, tests, or data quality notes.
Best practice
Add short comments whenever you make an operational change. It makes later QC and troubleshooting much faster.
-
Production data comments for linked wells and scenarios: you can link production data comments from the Main well to any child well.
- Optionally, you can choose not to link comments and instead maintain separate comments for scenarios and linked wells.
4.3. Table view
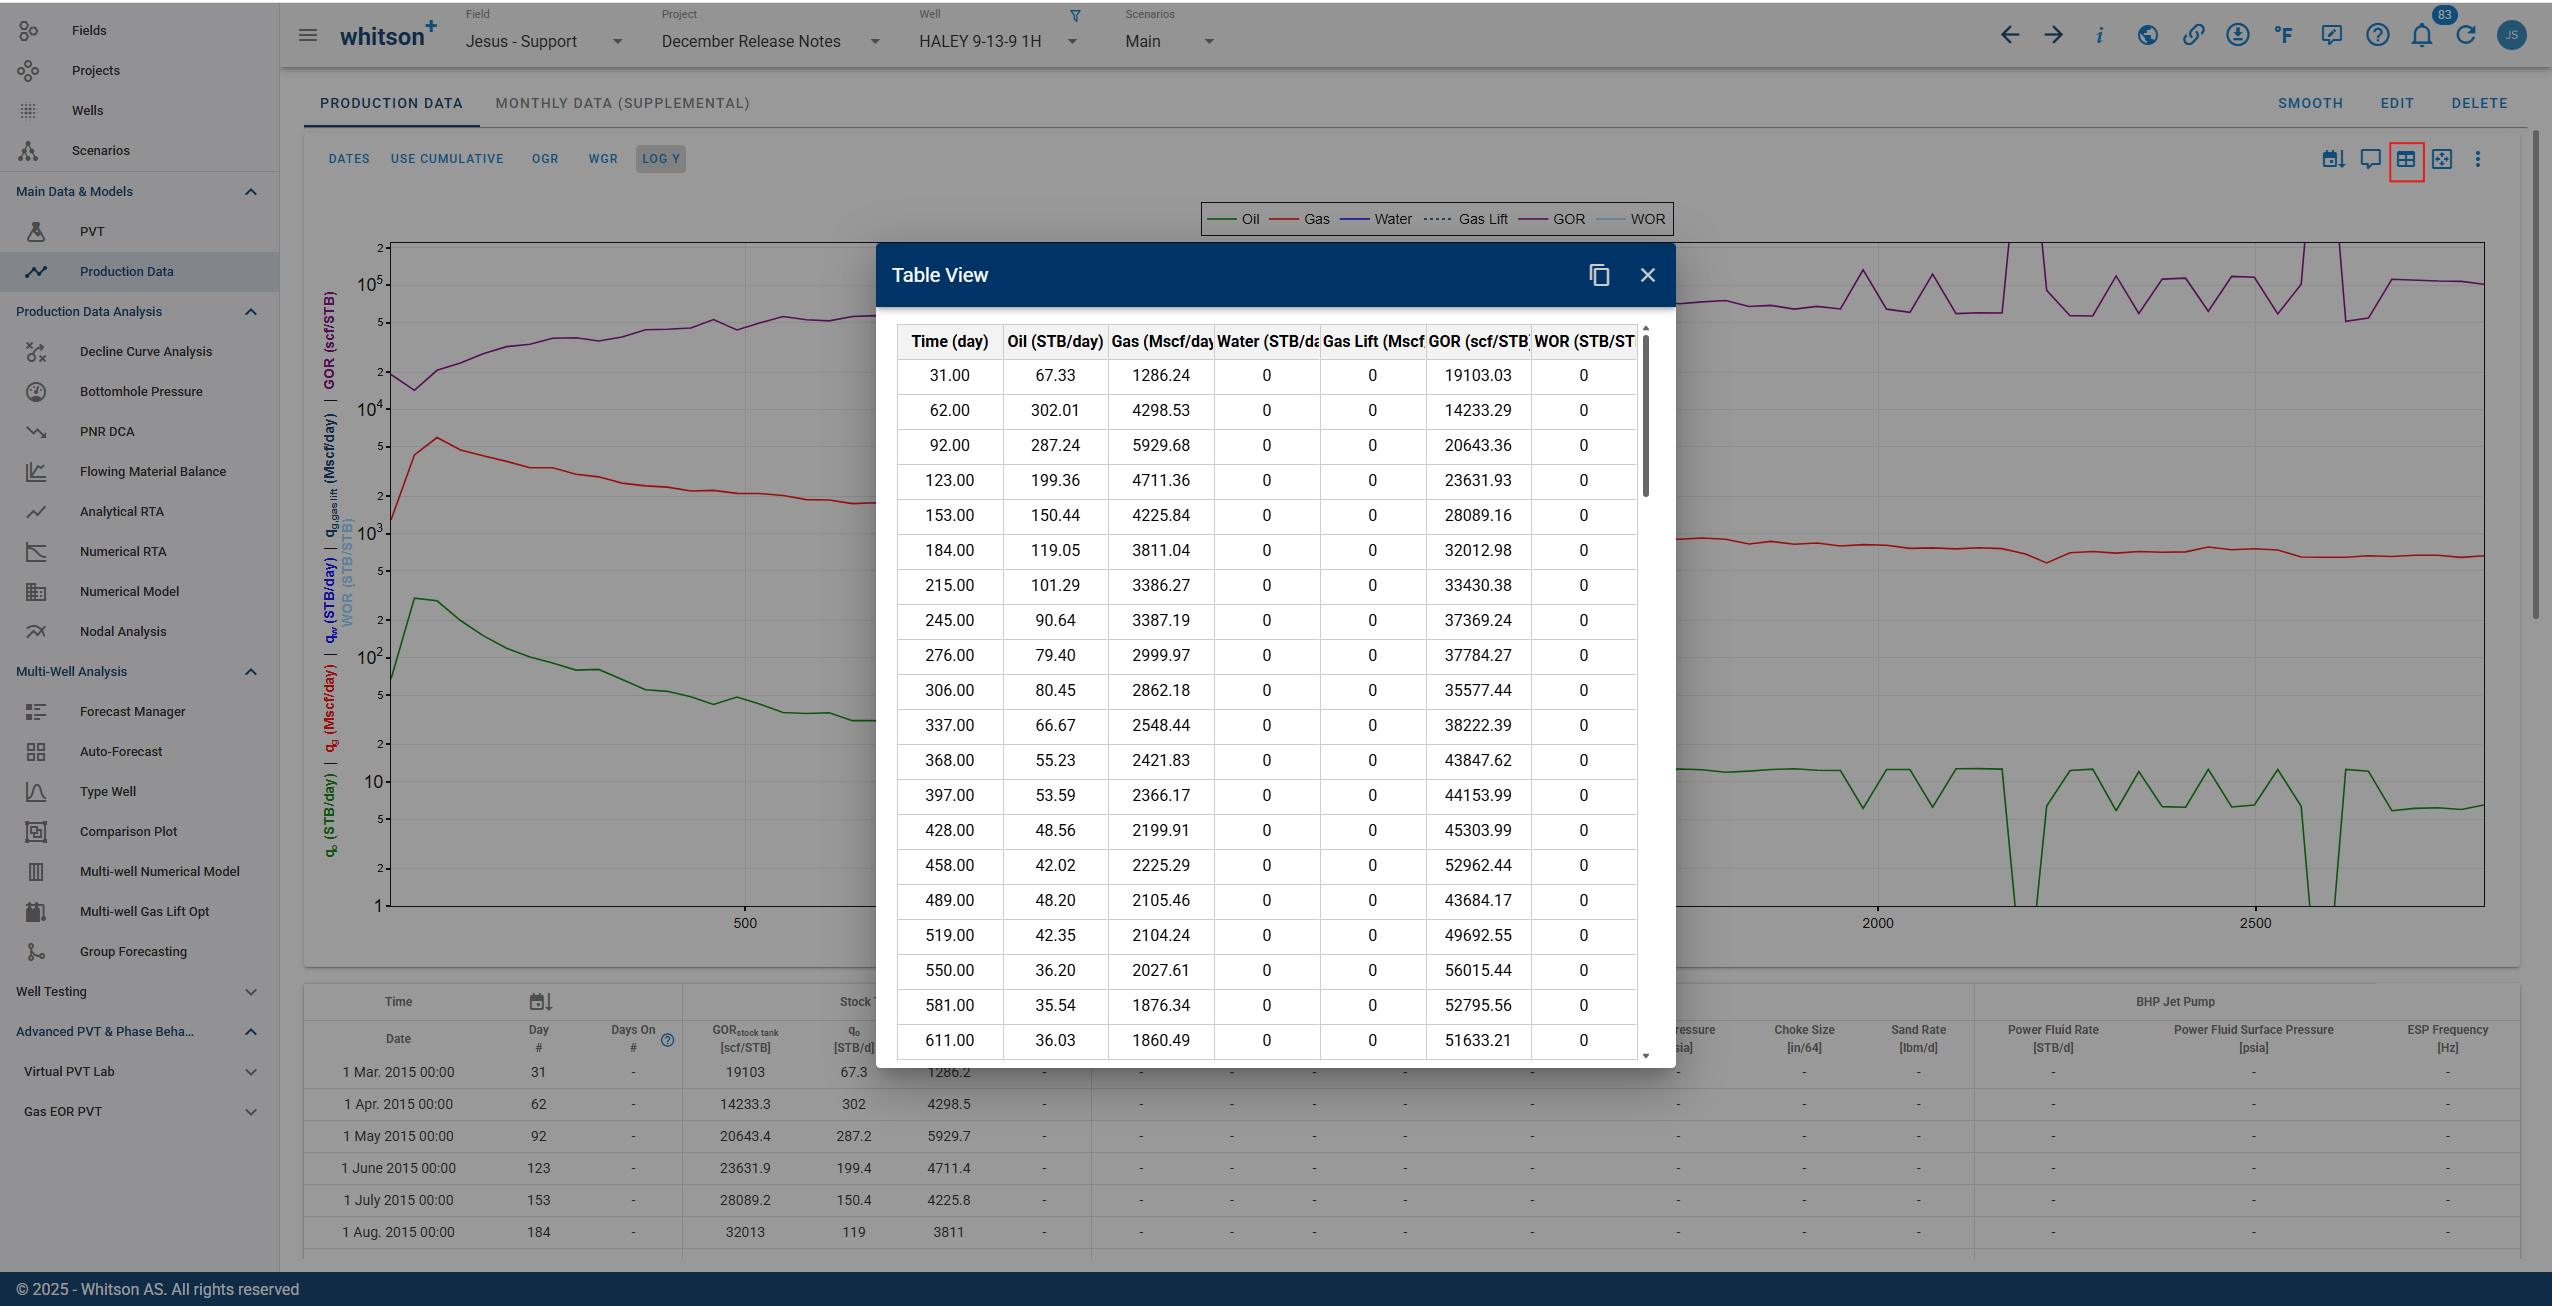
Use the Table View option to work directly with the data in a spreadsheet format.
5. Datadump pre-populated excel file
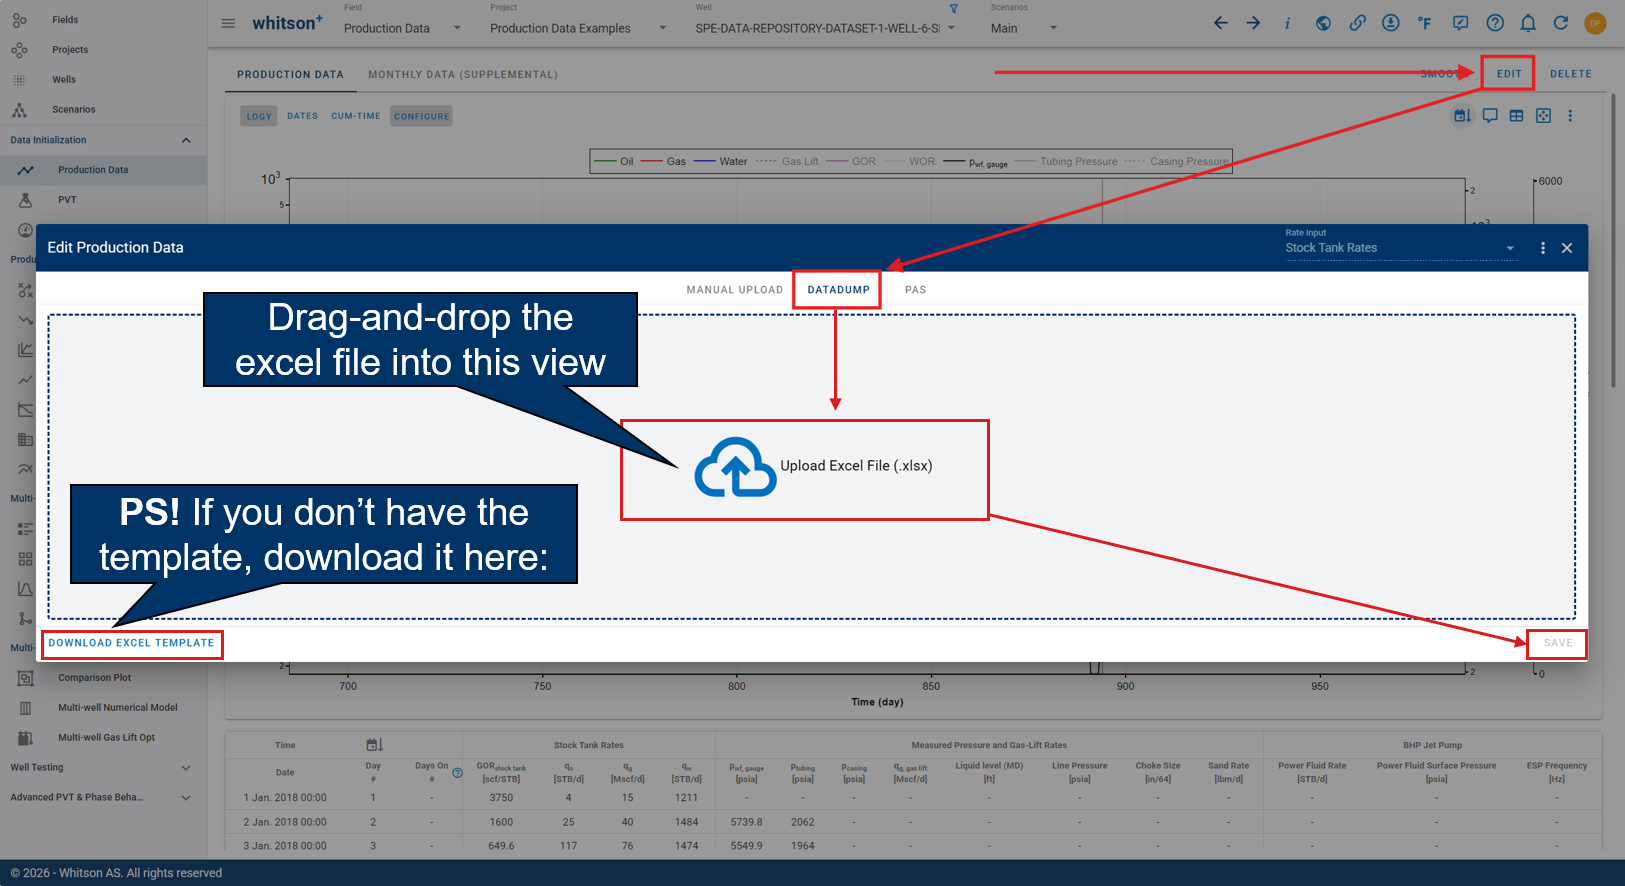
- Click the "arrow in the cloud" symbol to upload data.
- Click the datadump option at the top of the dialog box.
- Drag-and-drop the pre-populated datadump file into the frontend or select your file from your computer.
- If you don't have the template, you can access it by clicking "Download Excel Template" at the bottom left.
- Click SAVE in the lower right when finished.
- All the steps are shown in figure above for stock tank and separator data, respectively.
6. API or database connection for automatic data upload
Contact support@whitson.com to set this up for your company.