September 2026 Release Notes
Dear users of whitson+,
We’re happy to share the latest release of whitson+, fresh out of the coding oven. There is a lot of new functionality in this release; the whole overview can be seen below.
Make sure to CTRL + SHIFT + R in the browser to fetch the latest version!
Nodal Analysis: IPR Forecast and Gas Lift Design
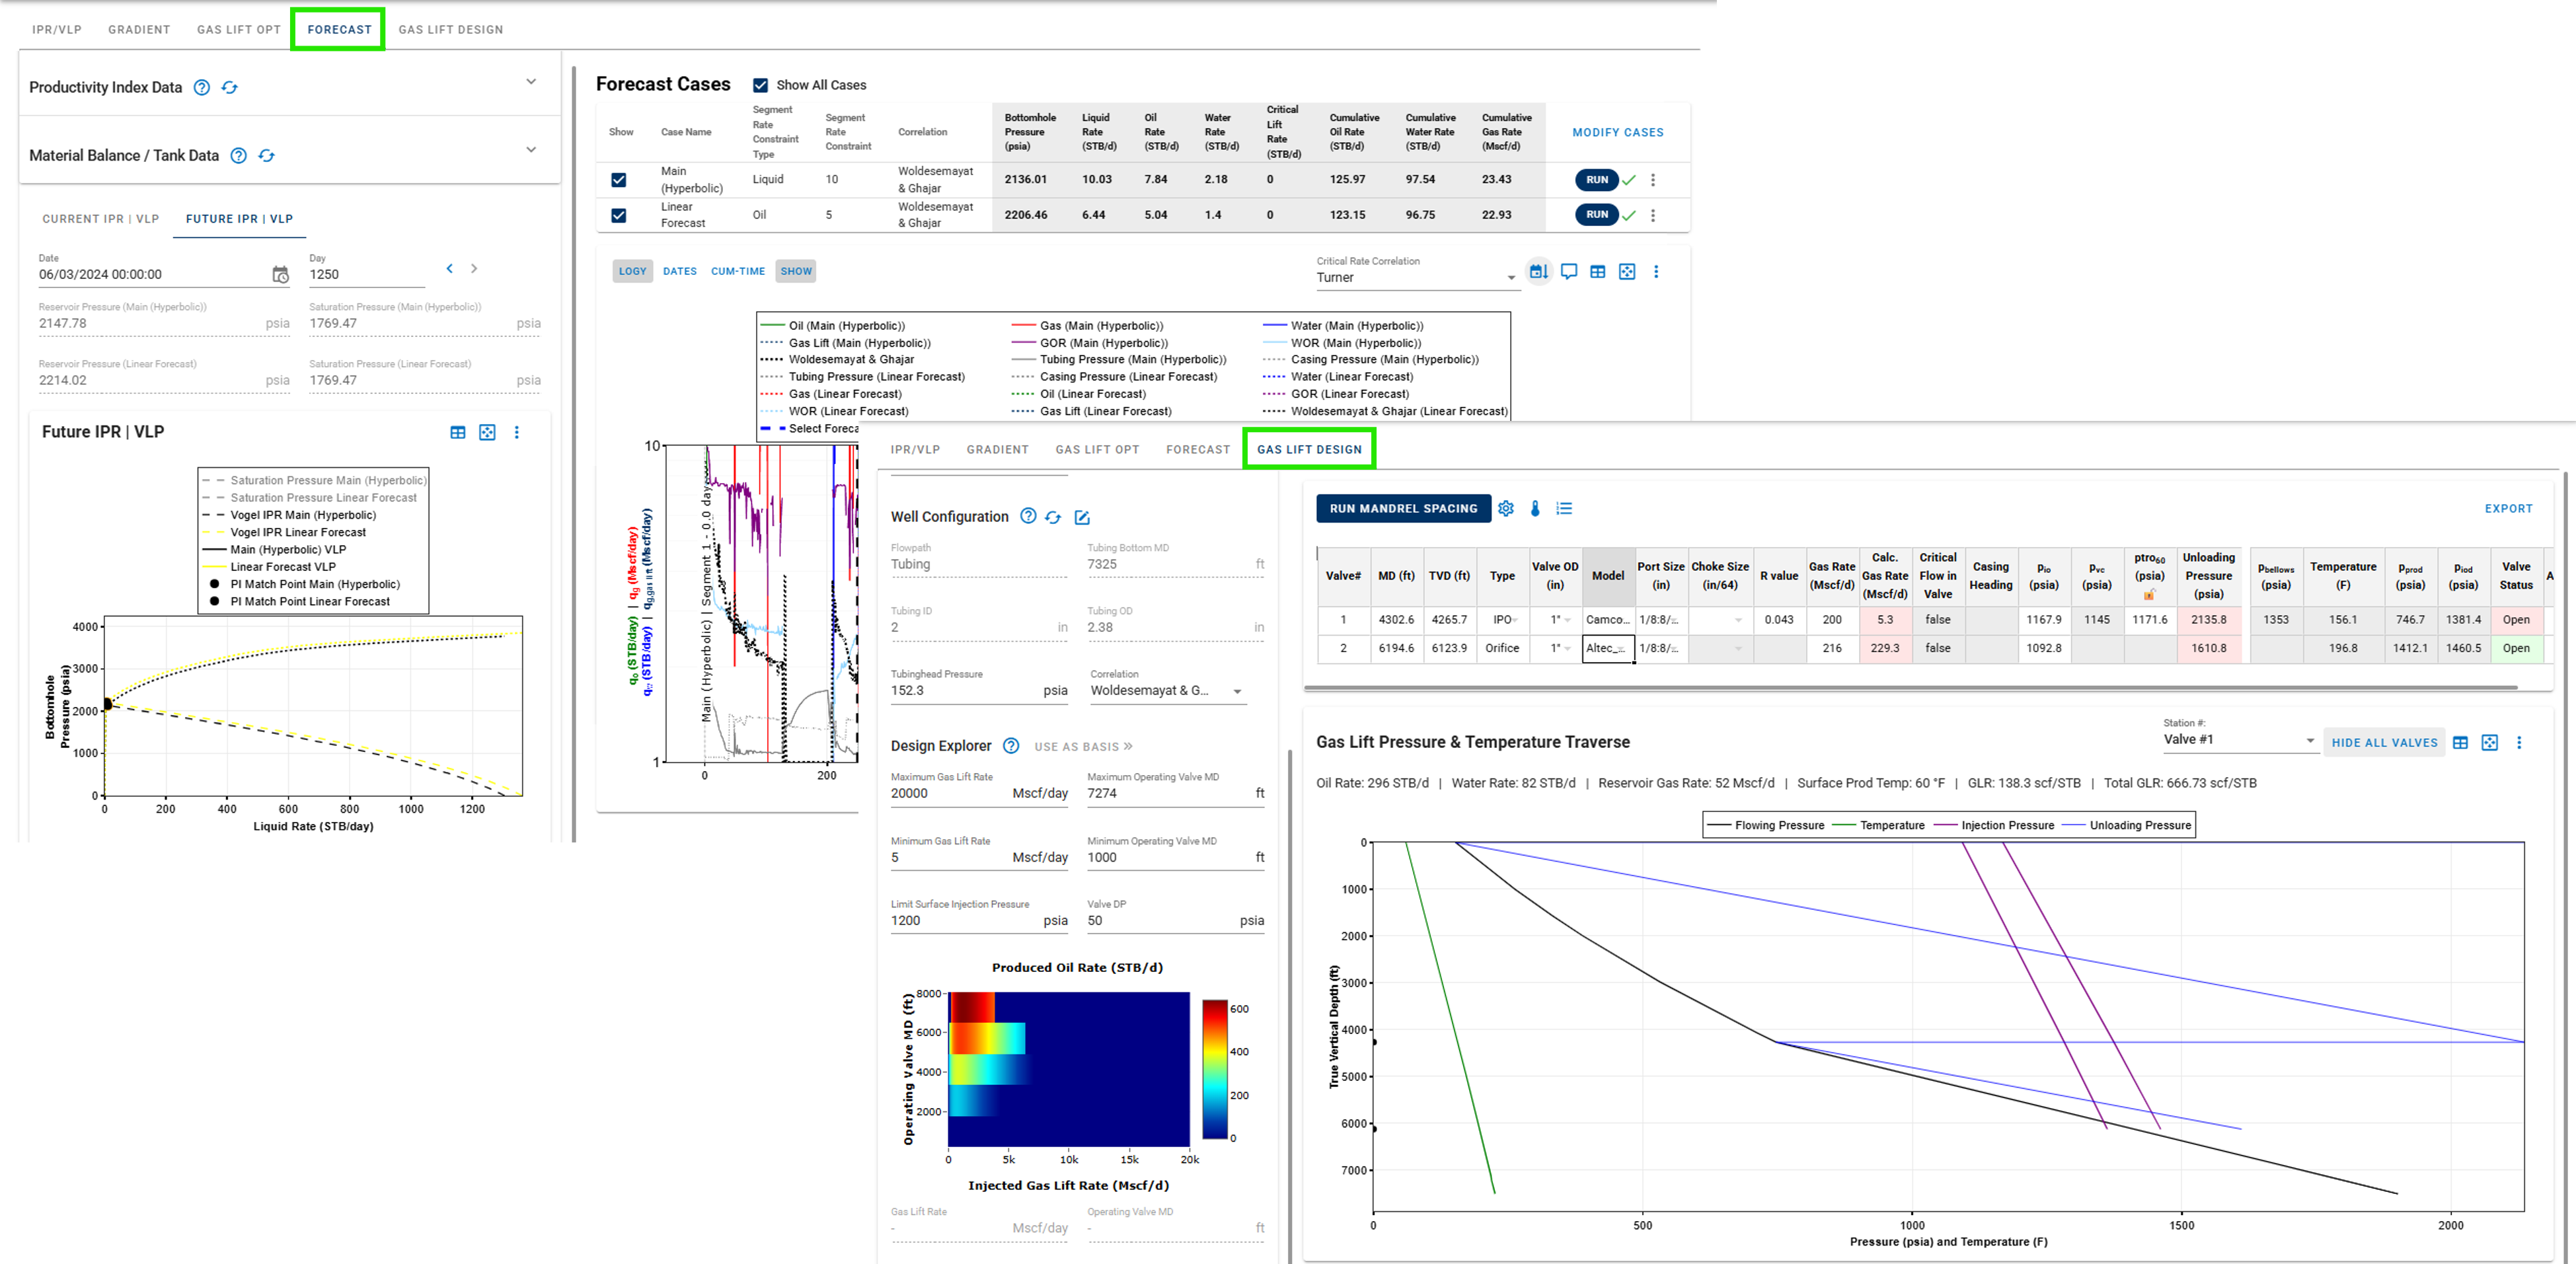
whitson+ expands the Nodal Analysis workflow with two major new capabilities: IPR Forecasting and Gas Lift Design. IPR Forecasting allows users to evaluate future well performance by generating future IPR/VLP conditions based on forecasted reservoir and operating conditions, while comparing multiple forecast cases and their resulting rates, pressures, and cumulative production. Gas Lift Design introduces a dedicated design workflow for evaluating gas lift valve placement and operating conditions, including mandrel-spacing calculations, valve performance, and pressure and temperature traverses. Together, these enhancements extend Nodal Analysis beyond current well-performance evaluation to support forward-looking production forecasting and artificial-lift design within the same workflow.
Production Data
-
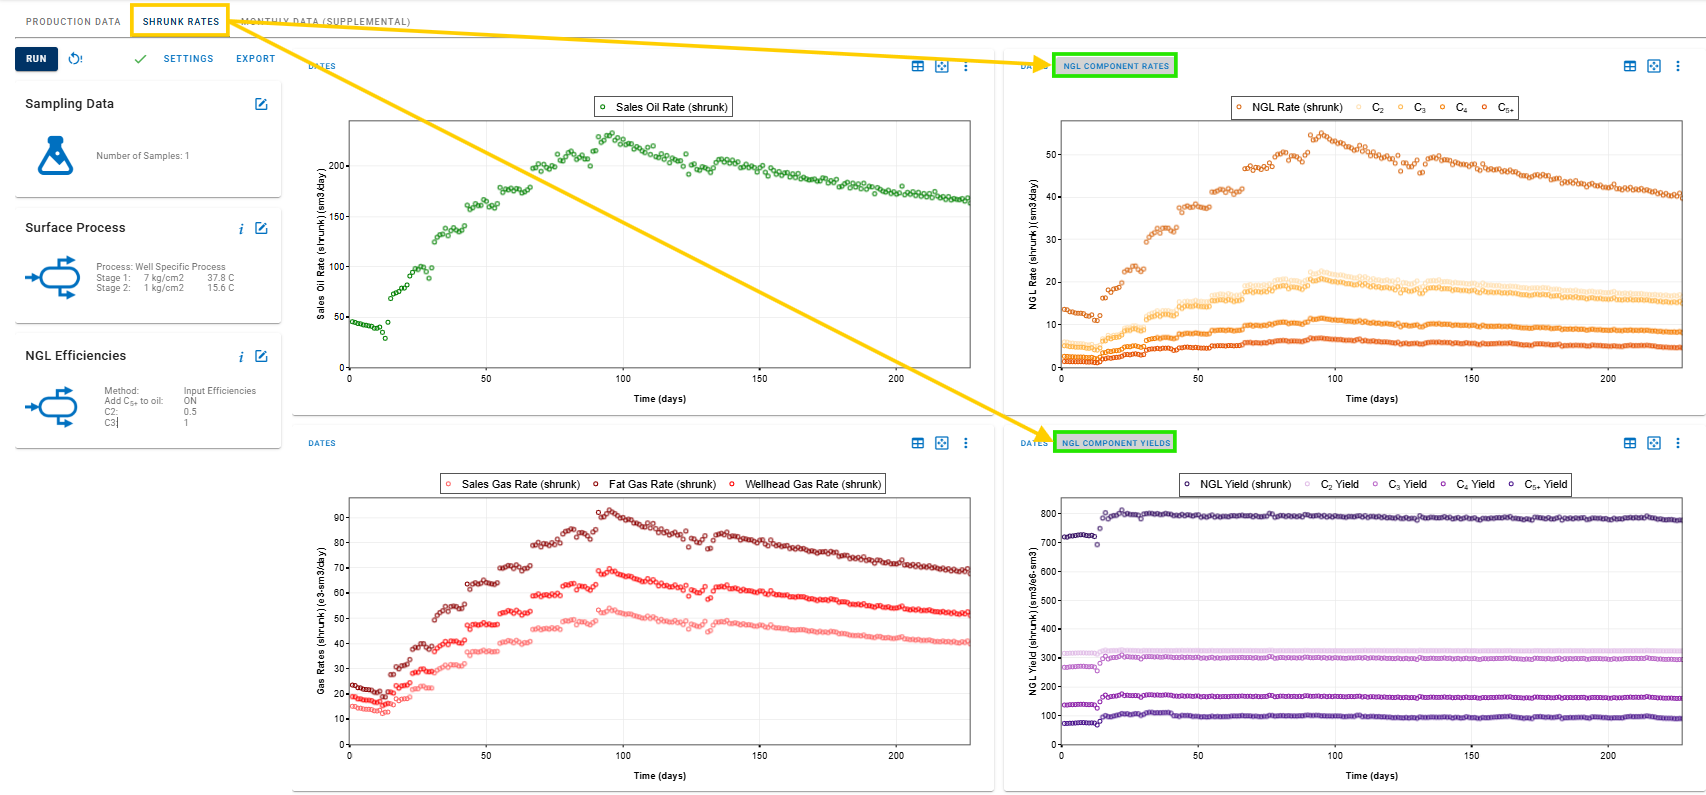
Add toggles for individual plots of , , , and NGL component rates and yields in the Shrunk Rates tab.
-
New production data series: Water Salinity.
-
Production data comments now include additional metadata: Updated By and Date Updated. This makes it easier to track when comments were modified and by whom.
-
Add Last Update Date metadata to production data and associated common process tables.
-
Apply reusable templates in the Production Data plot, allowing preferred configurations to be saved and reused.
-
BHP production-data handling has been updated by removing the Active BHP Injection mode and adding dedicated Water Injection and Gas Injection columns.
-
Add an export option to the Shrunk Rates / Common Process tab that exports all available sheets for Separator, Common Process, and NGL when the composition calculation is activated.
-
Rearrange the order of Production Data plots when Advanced mode is enabled for a more organized plotting workflow.
DCA and PNR DCA
-
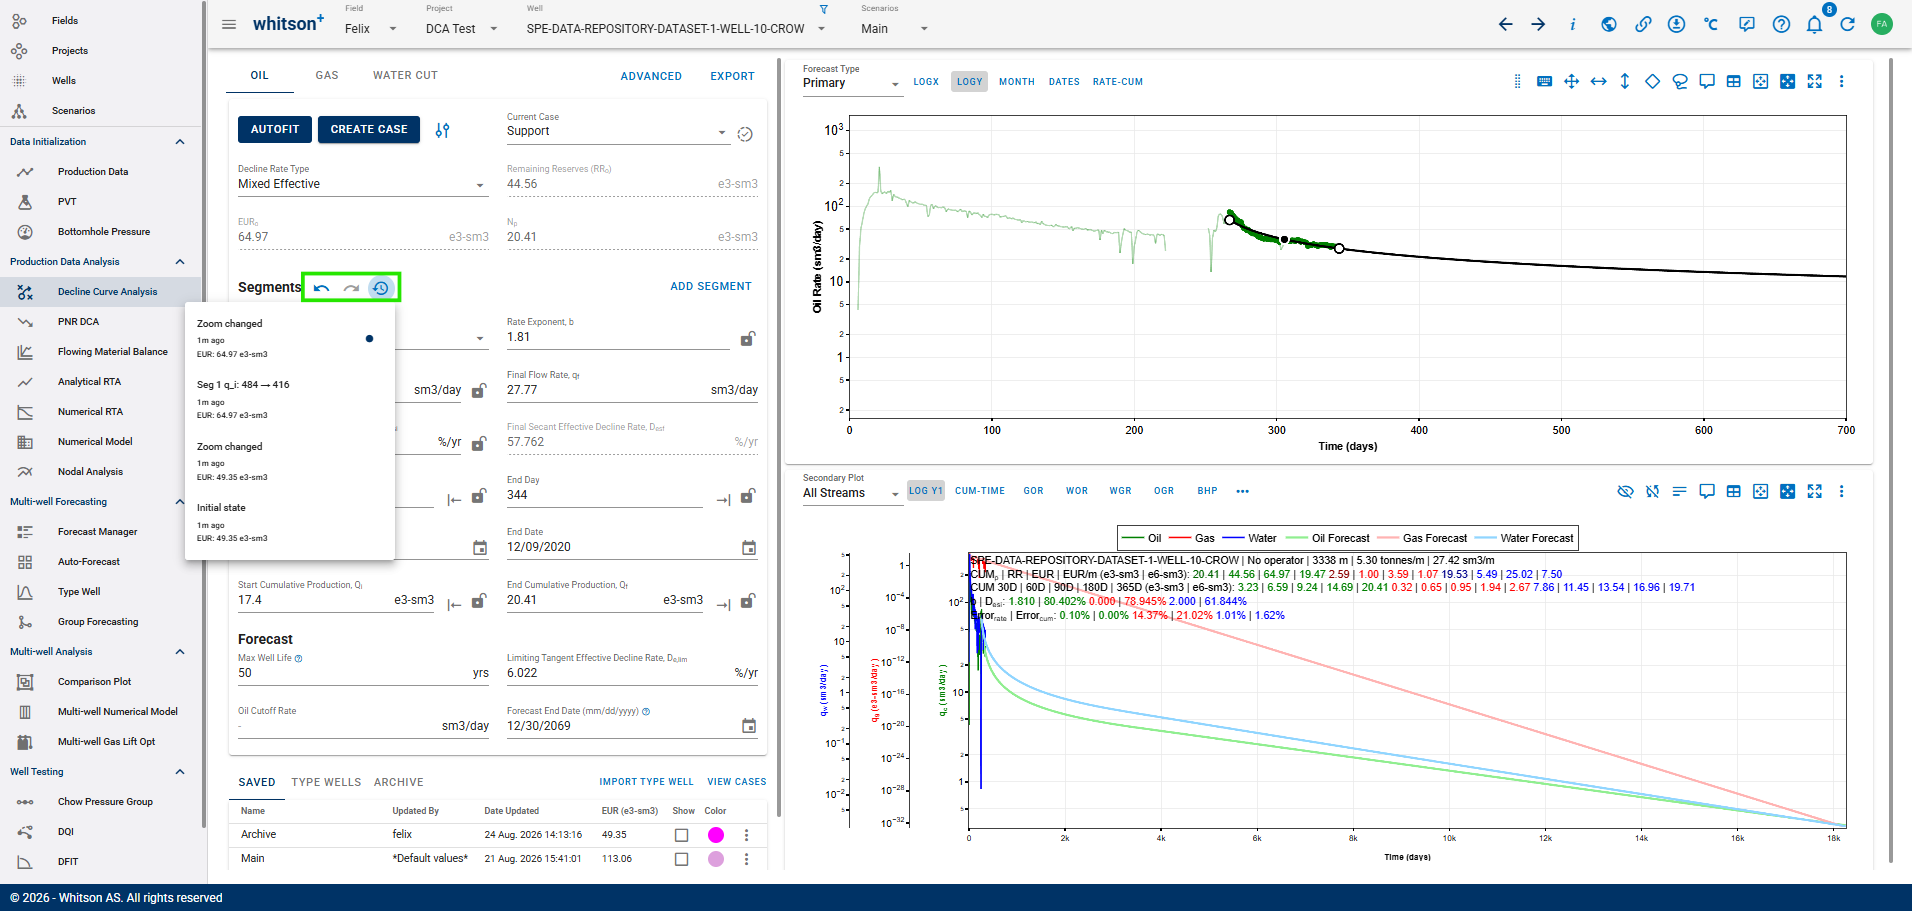
DCA workflows now support Undo/Redo, making it easier to reverse or reapply forecast edits.
-
Add a Sahara upload template for DCA forecasts.
-
Add a new Val Nav export option.
-
Users can now unarchive individual or multiple DCA cases that they previously archived.
-
Bulk View:
-
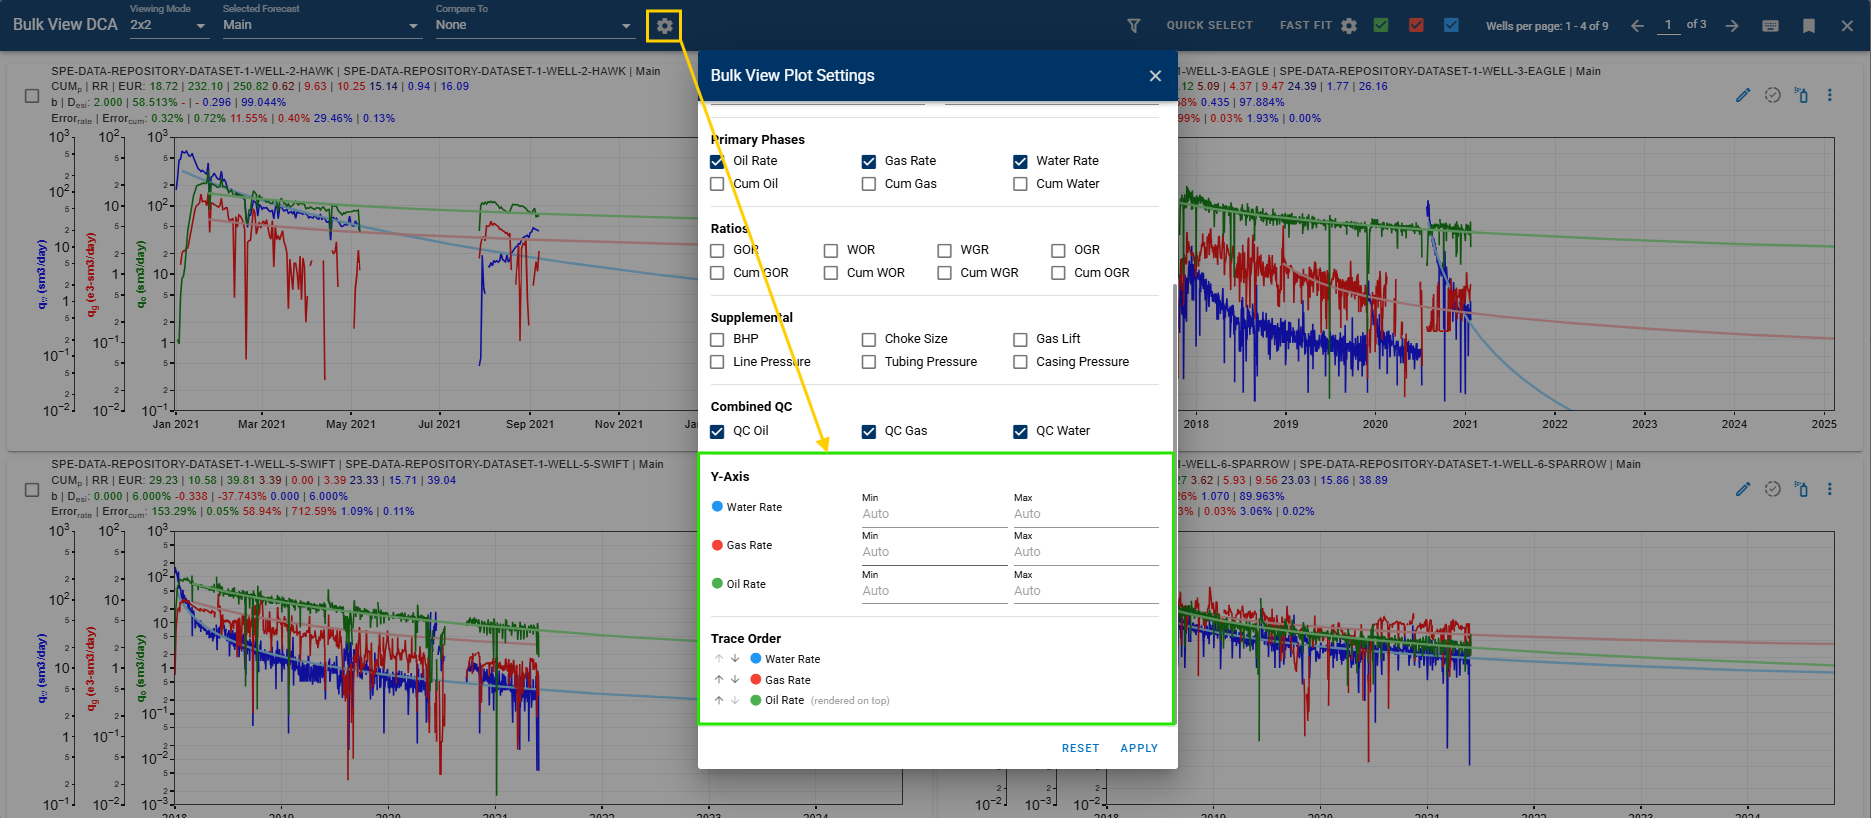
Add control over the z-order of plot traces, allowing users to determine which traces appear in front of others.
-
Add the ability to define y-axis minimum and maximum values across all y-axes.
-
-
ARIES mode: ARIES table interaction has received several spreadsheet-style workflow improvements:
-
Highlighted rows can now be deleted using Backspace.
-
Highlighted ranges support Paste operations.
-
Pasting into a single selected cell can automatically populate the appropriate cells or rows.
-
Highlighted ranges can be copied.
-
Cell states are now color-coded:
- Red for read-only cells.
- Blue for editable cells.
-
Pasted dates are automatically converted to a valid ARIES date format.
-
-
Add Partial Fit support to the Bulk Autofit workflow, providing additional flexibility when fitting PNR DCA forecasts across multiple wells.
BHP / Nodal Analysis / Multi-well Gas Lift Optimizer
-
Add Bulk Edit Custom , allowing users to update custom flowing bottomhole pressure inputs across multiple wells more efficiently.
-
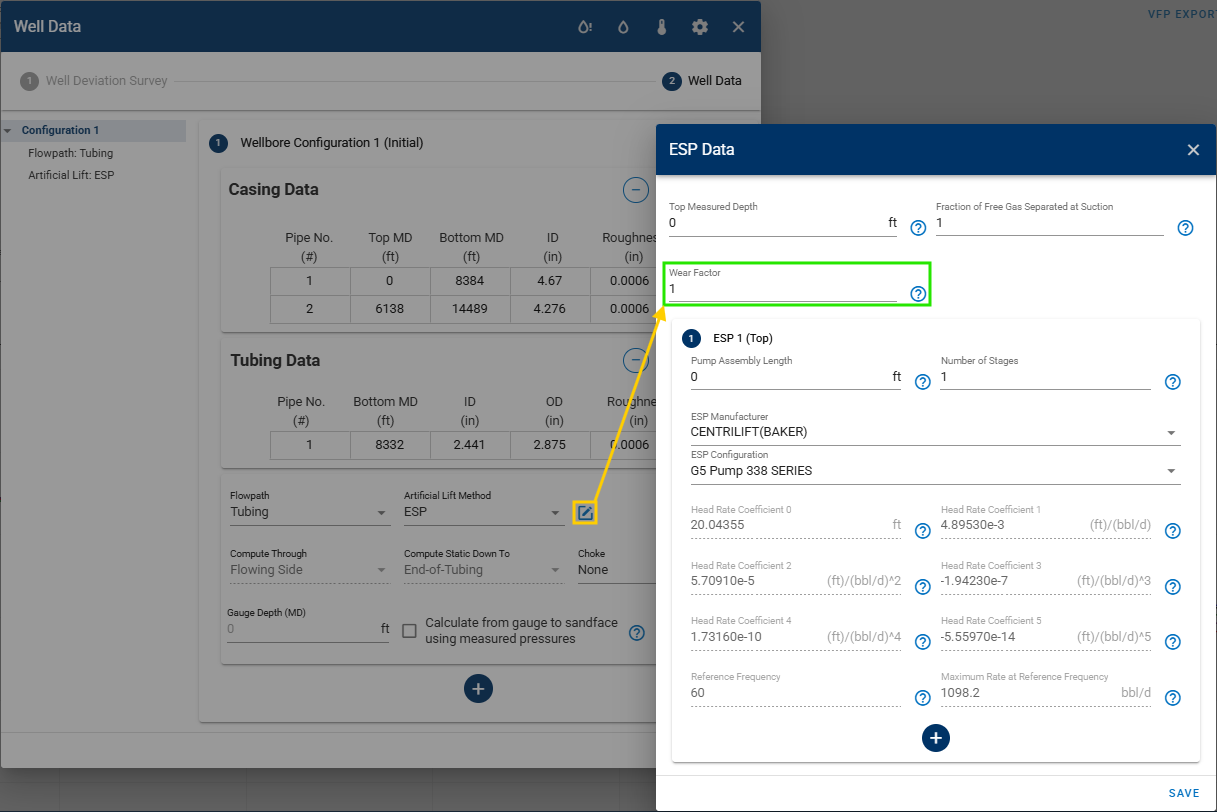
Add an ESP Wear Factor for accounting for pump degradation in ESP performance calculations. The input value will multiply the stage delta head.
-
ESP calculations now neglect stage differential pressure when the operating rate exceeds the pump maximum rate ().
-
Rod Pump configurations now support pump depths where MD < EOT.
-
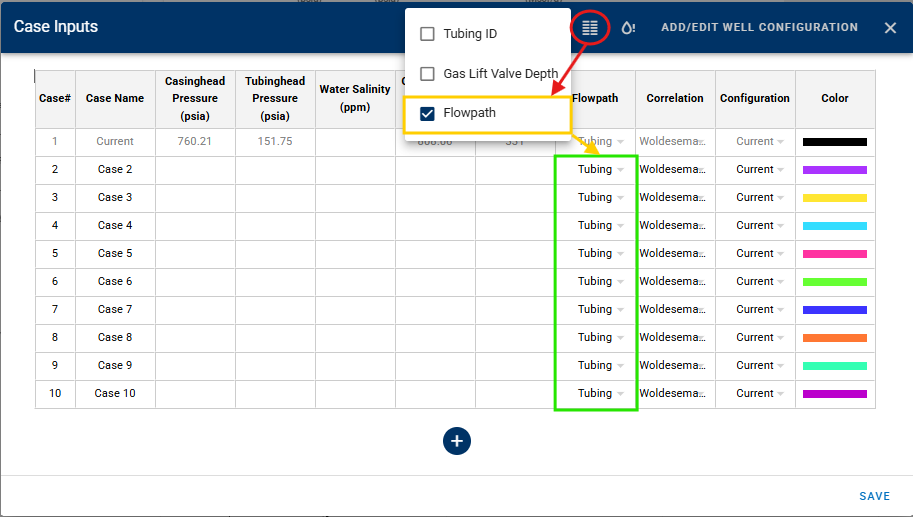
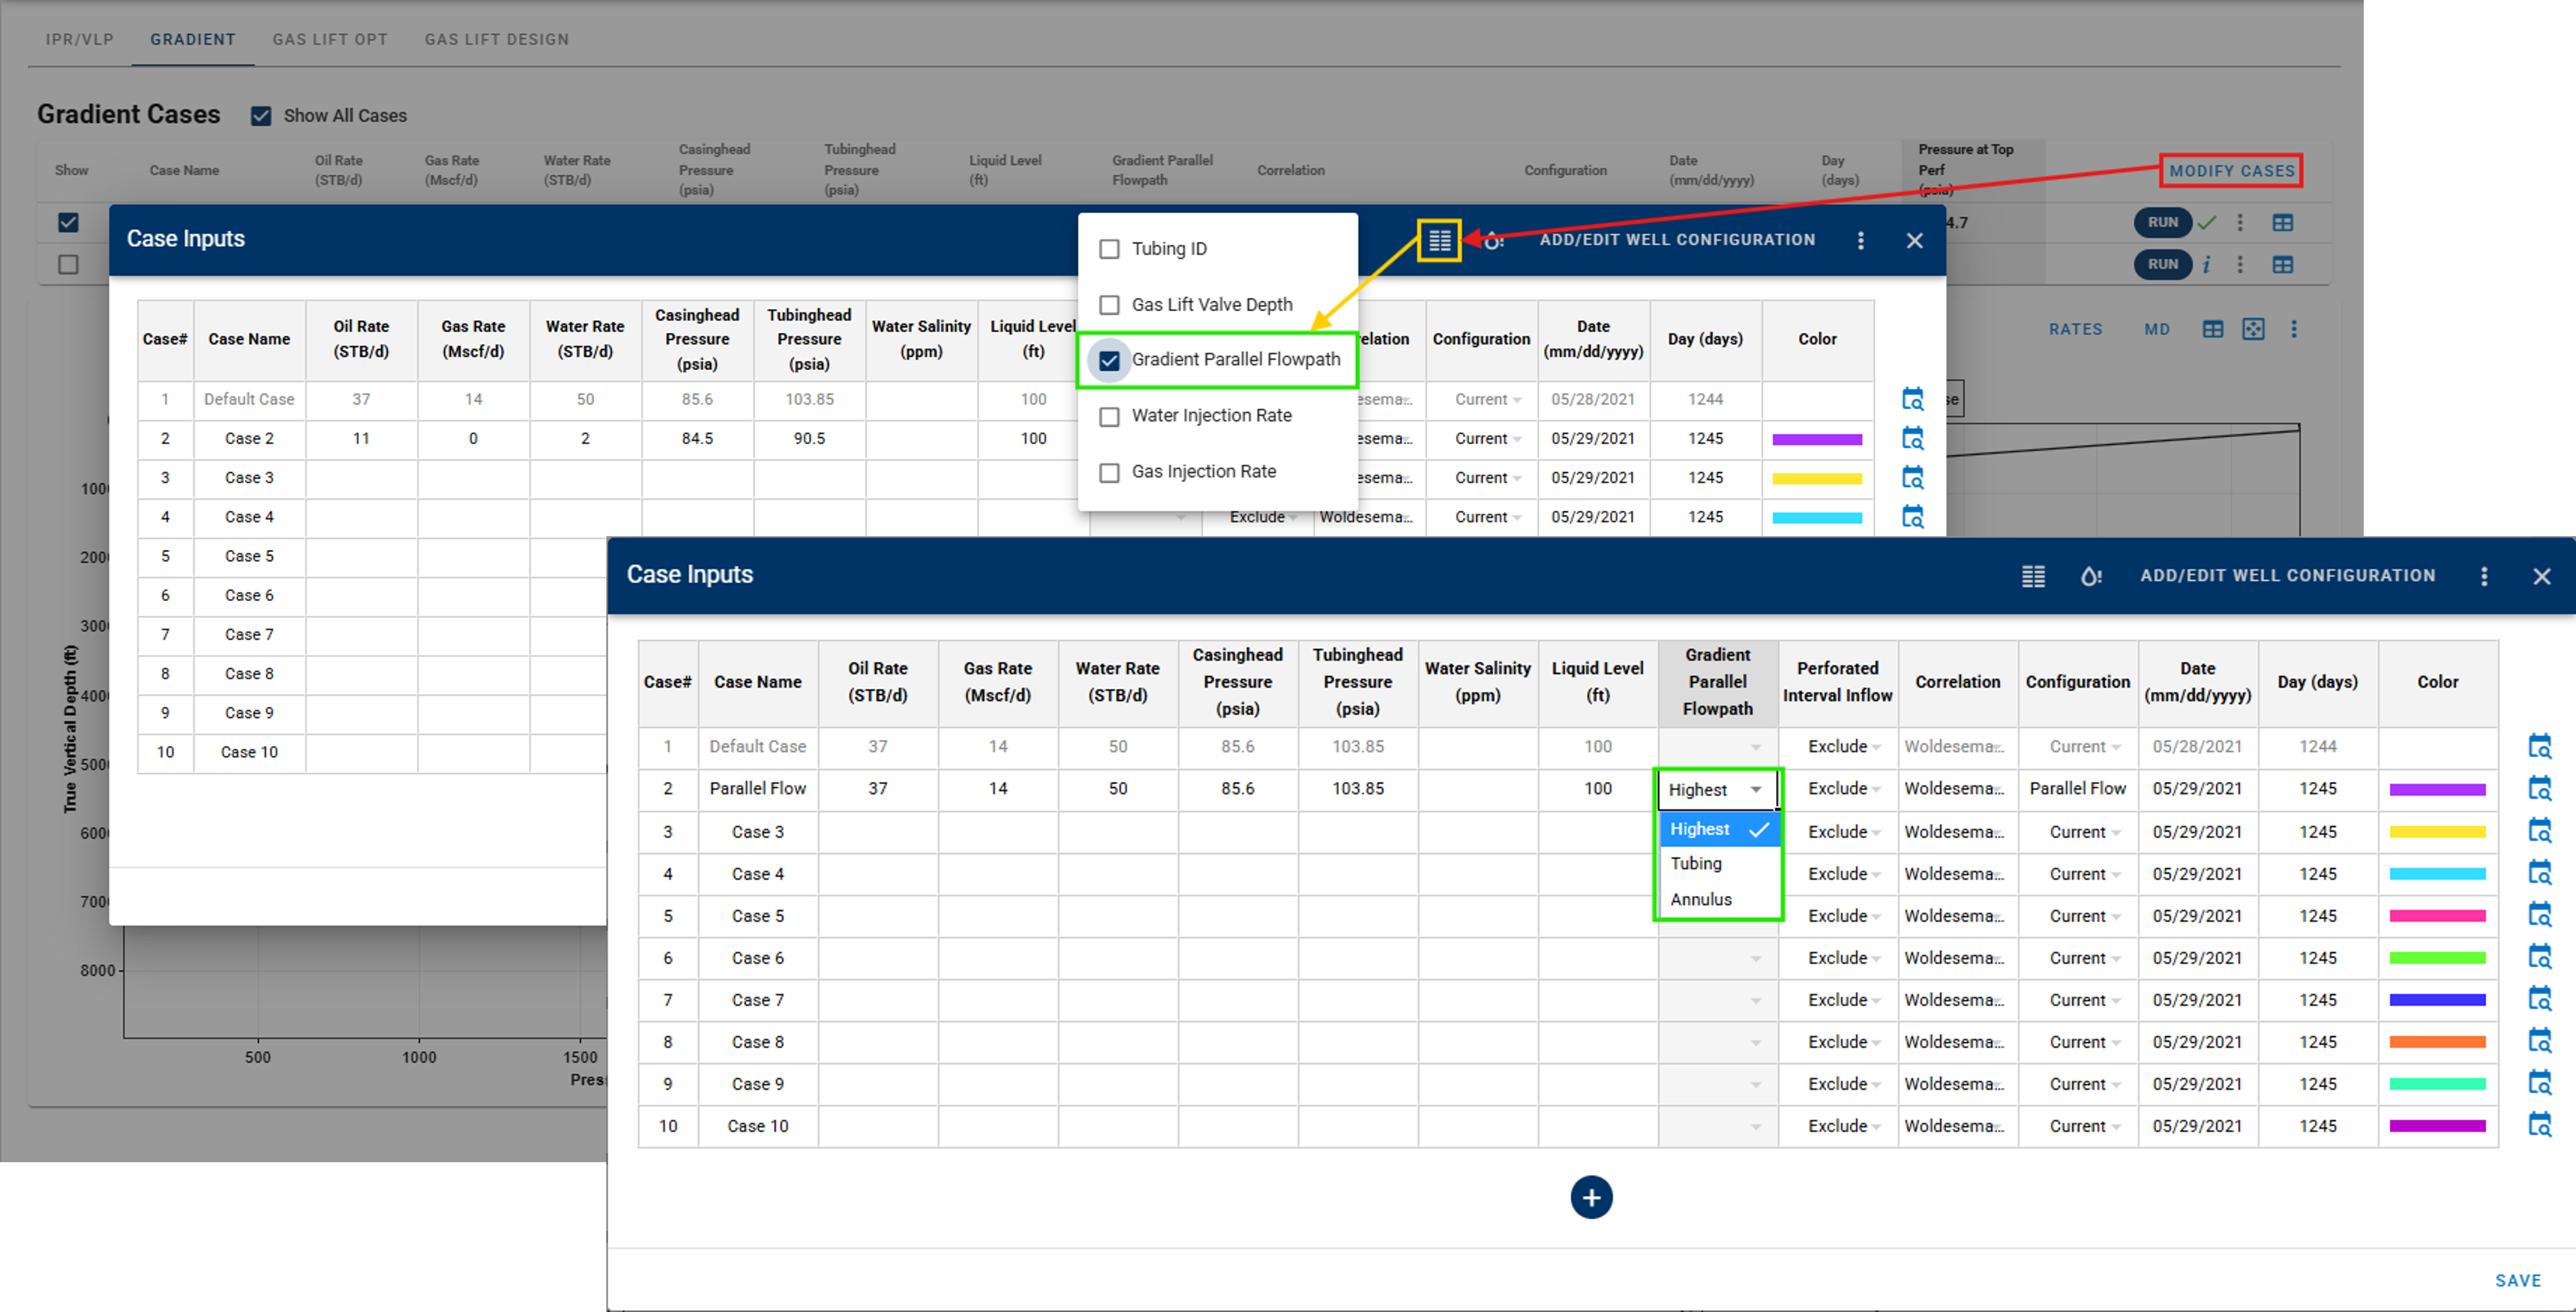
New column in the cases table across Nodal Analysis: Flowpath. Quick access to change the flowpath calculation for selected configuration without need to create a new configuration.
-
Add a Parallel Flow input to Gradient cases in Nodal Analysis. The selector will be active for cases with a parallel flowpath configuration.
-
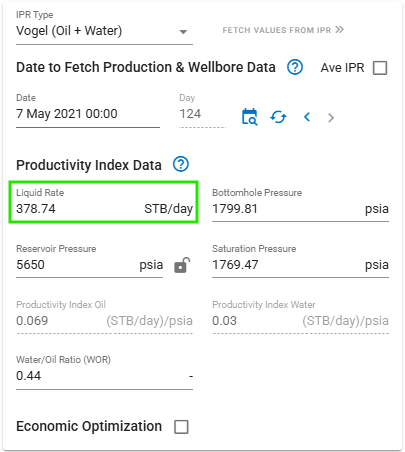
Enable calculations from gauge measurements for locations where gauge MD < EOT in parallel flow configuration.
-
Add combined Tubing + Annulus critical rate output for Parallel Flow locations where gauge MD < EOT.
-
Enable Foamer Injection within Nodal Analysis.
-
Add VLP Results table to the Results page for easier access to calculated VLP outputs.
-
Add Liquid Rate switch button to the Single-Well Gas Lift plot. Allowing users to flip the analysis between oil and liquid.
-
Display Scenario information on the Gas Lift Results page.
-
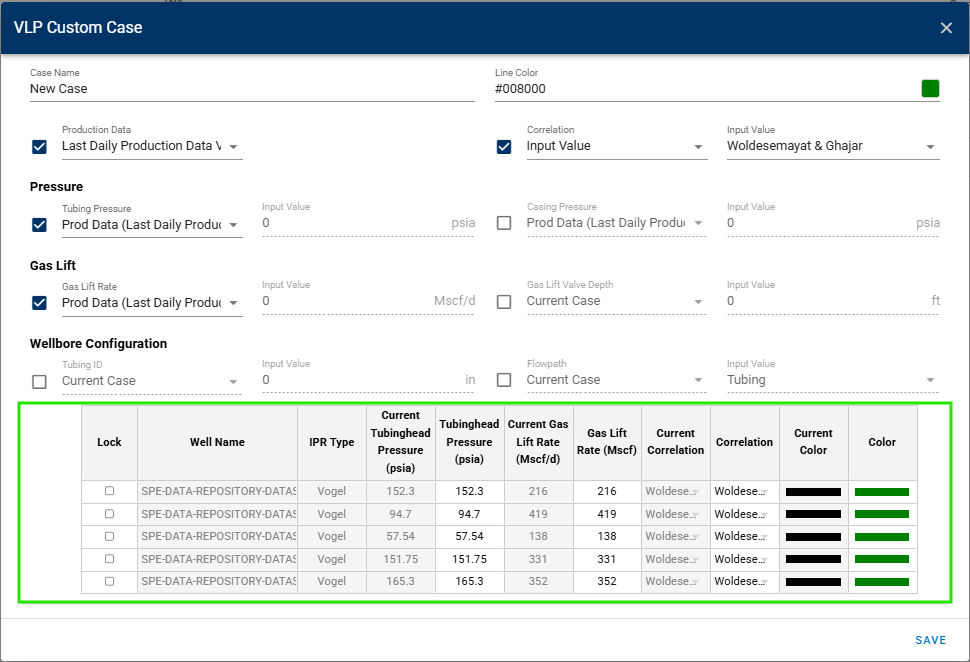
Bulk run IPR/VLP Custom Case: add a table input for custom cases when bulk running IPR/VLP, allowing users to customize and combine different settings across wells.
-
Multi-Well Gas Lift Optimizer settings now support Flowing Wellhead Pressure and Injection Wellhead Pressure.
RTA and NRTA
-
Fractional RTA customizations can now be persisted, including settings such as plot zoom and line intercept.
-
Add a GOR / OGR toggle in the Numerical RTA plot.
Numerical Model
-
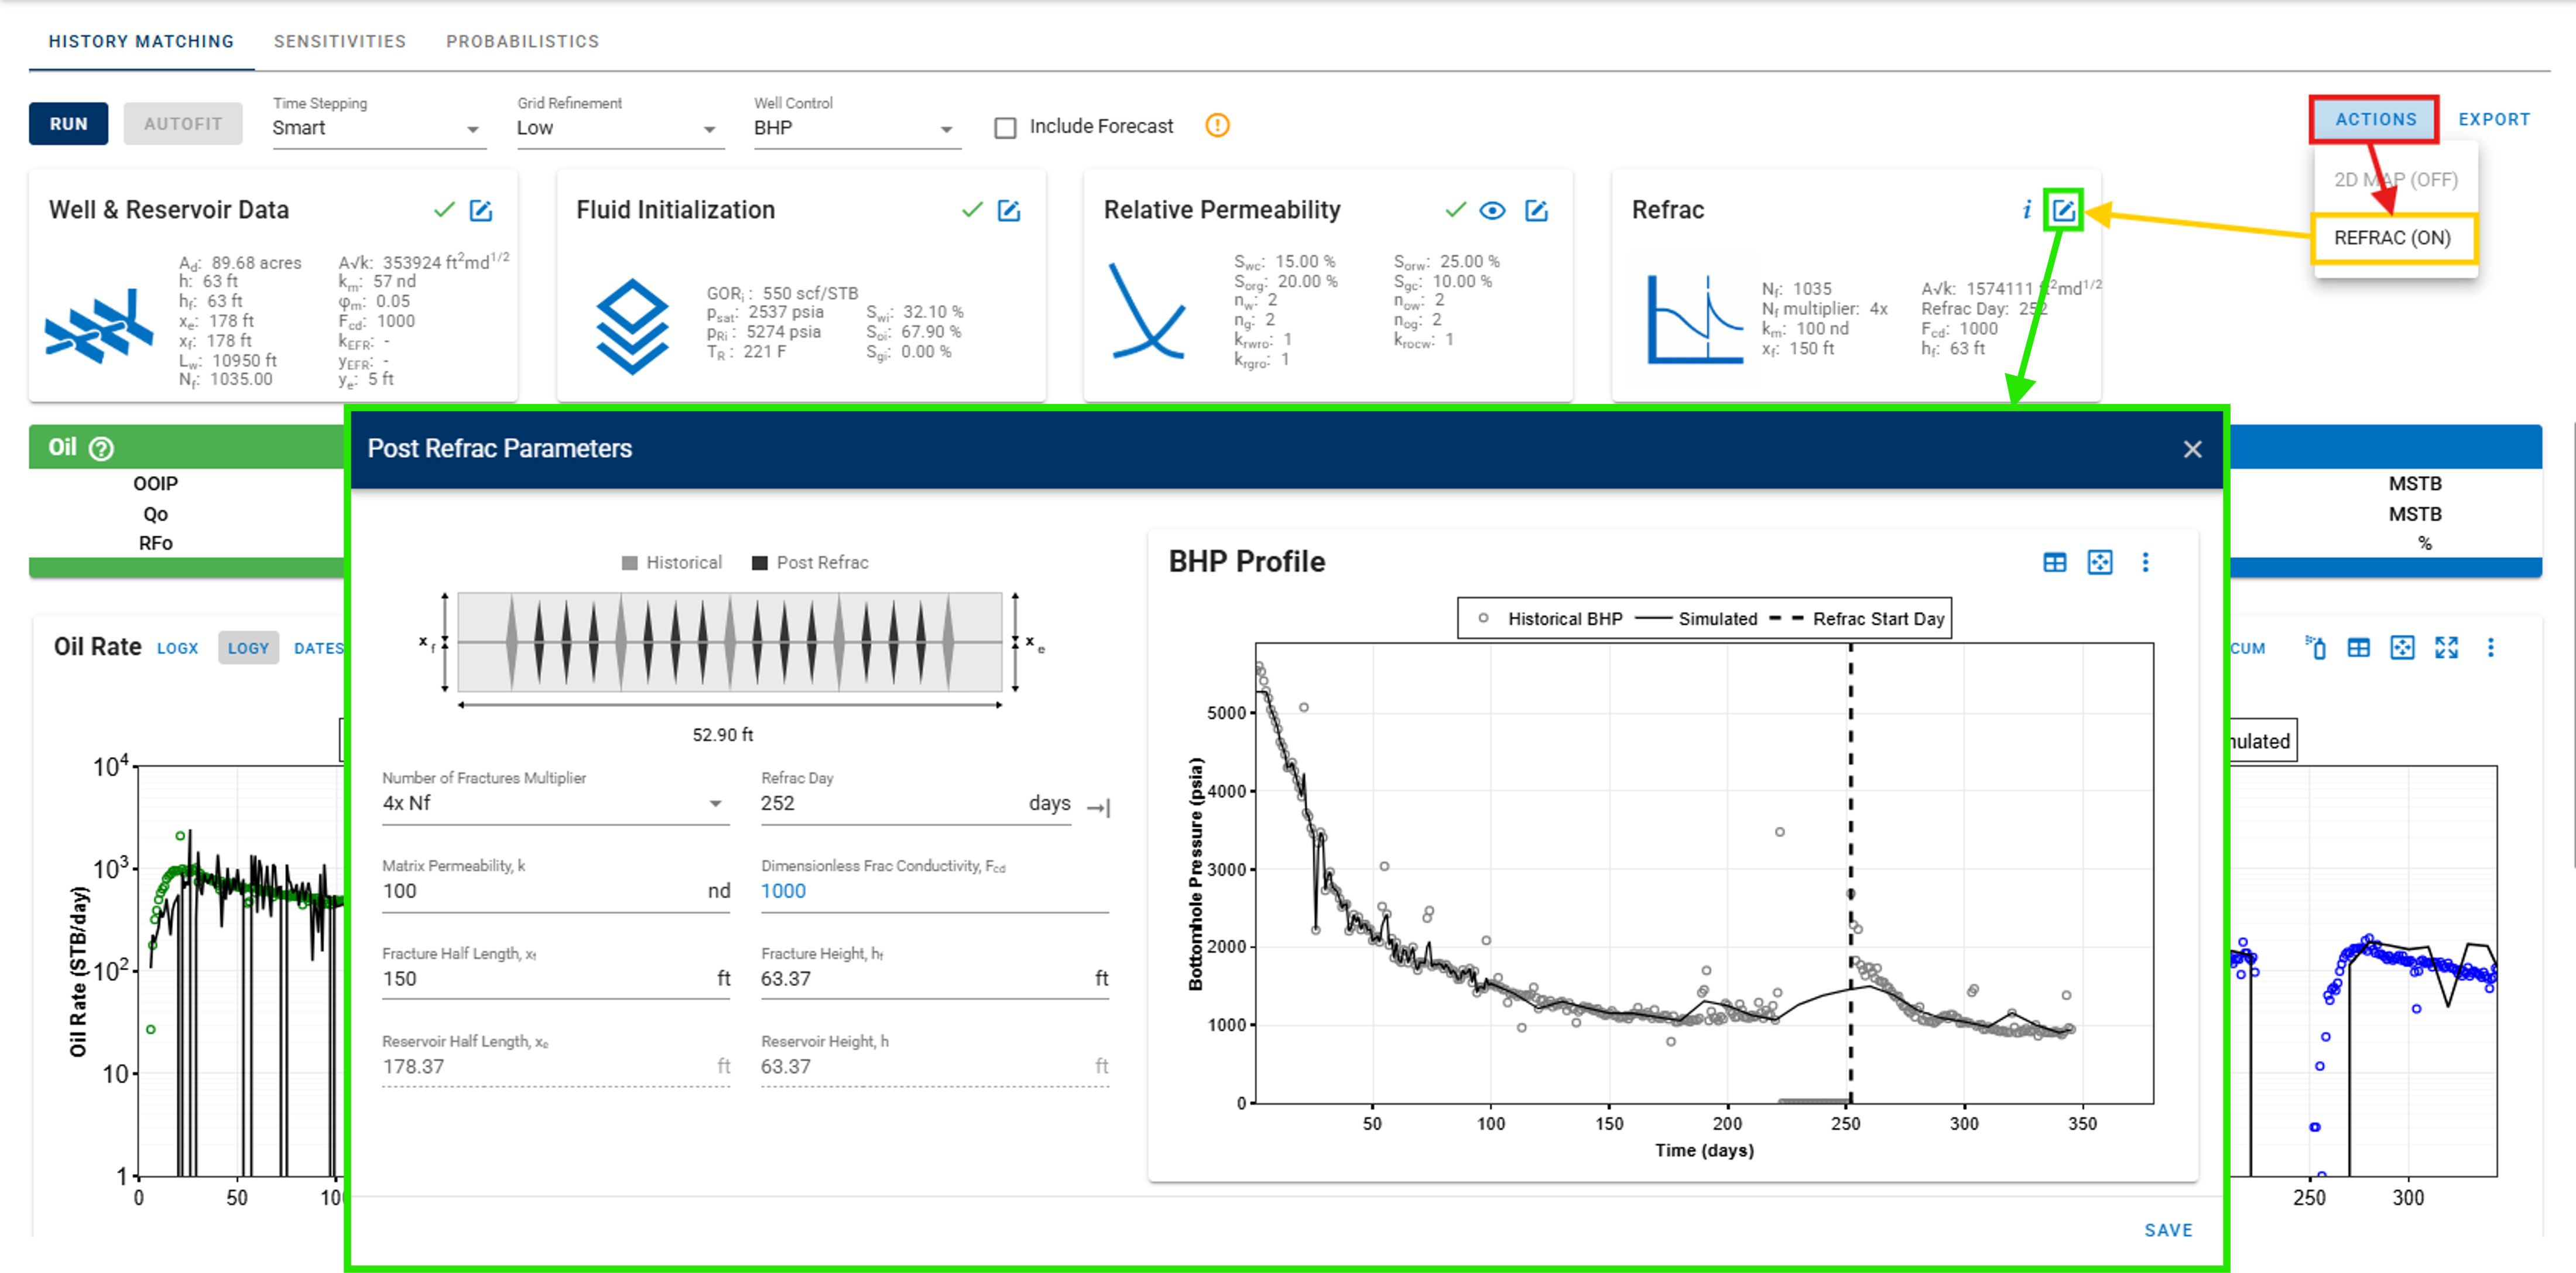
Add a Refrac option for multi-fractured horizontal wells, available in: History Matching, Sensitivities, and Probabilistics.
-
Enable sensitivities for each layer when having multilayer properties.
-
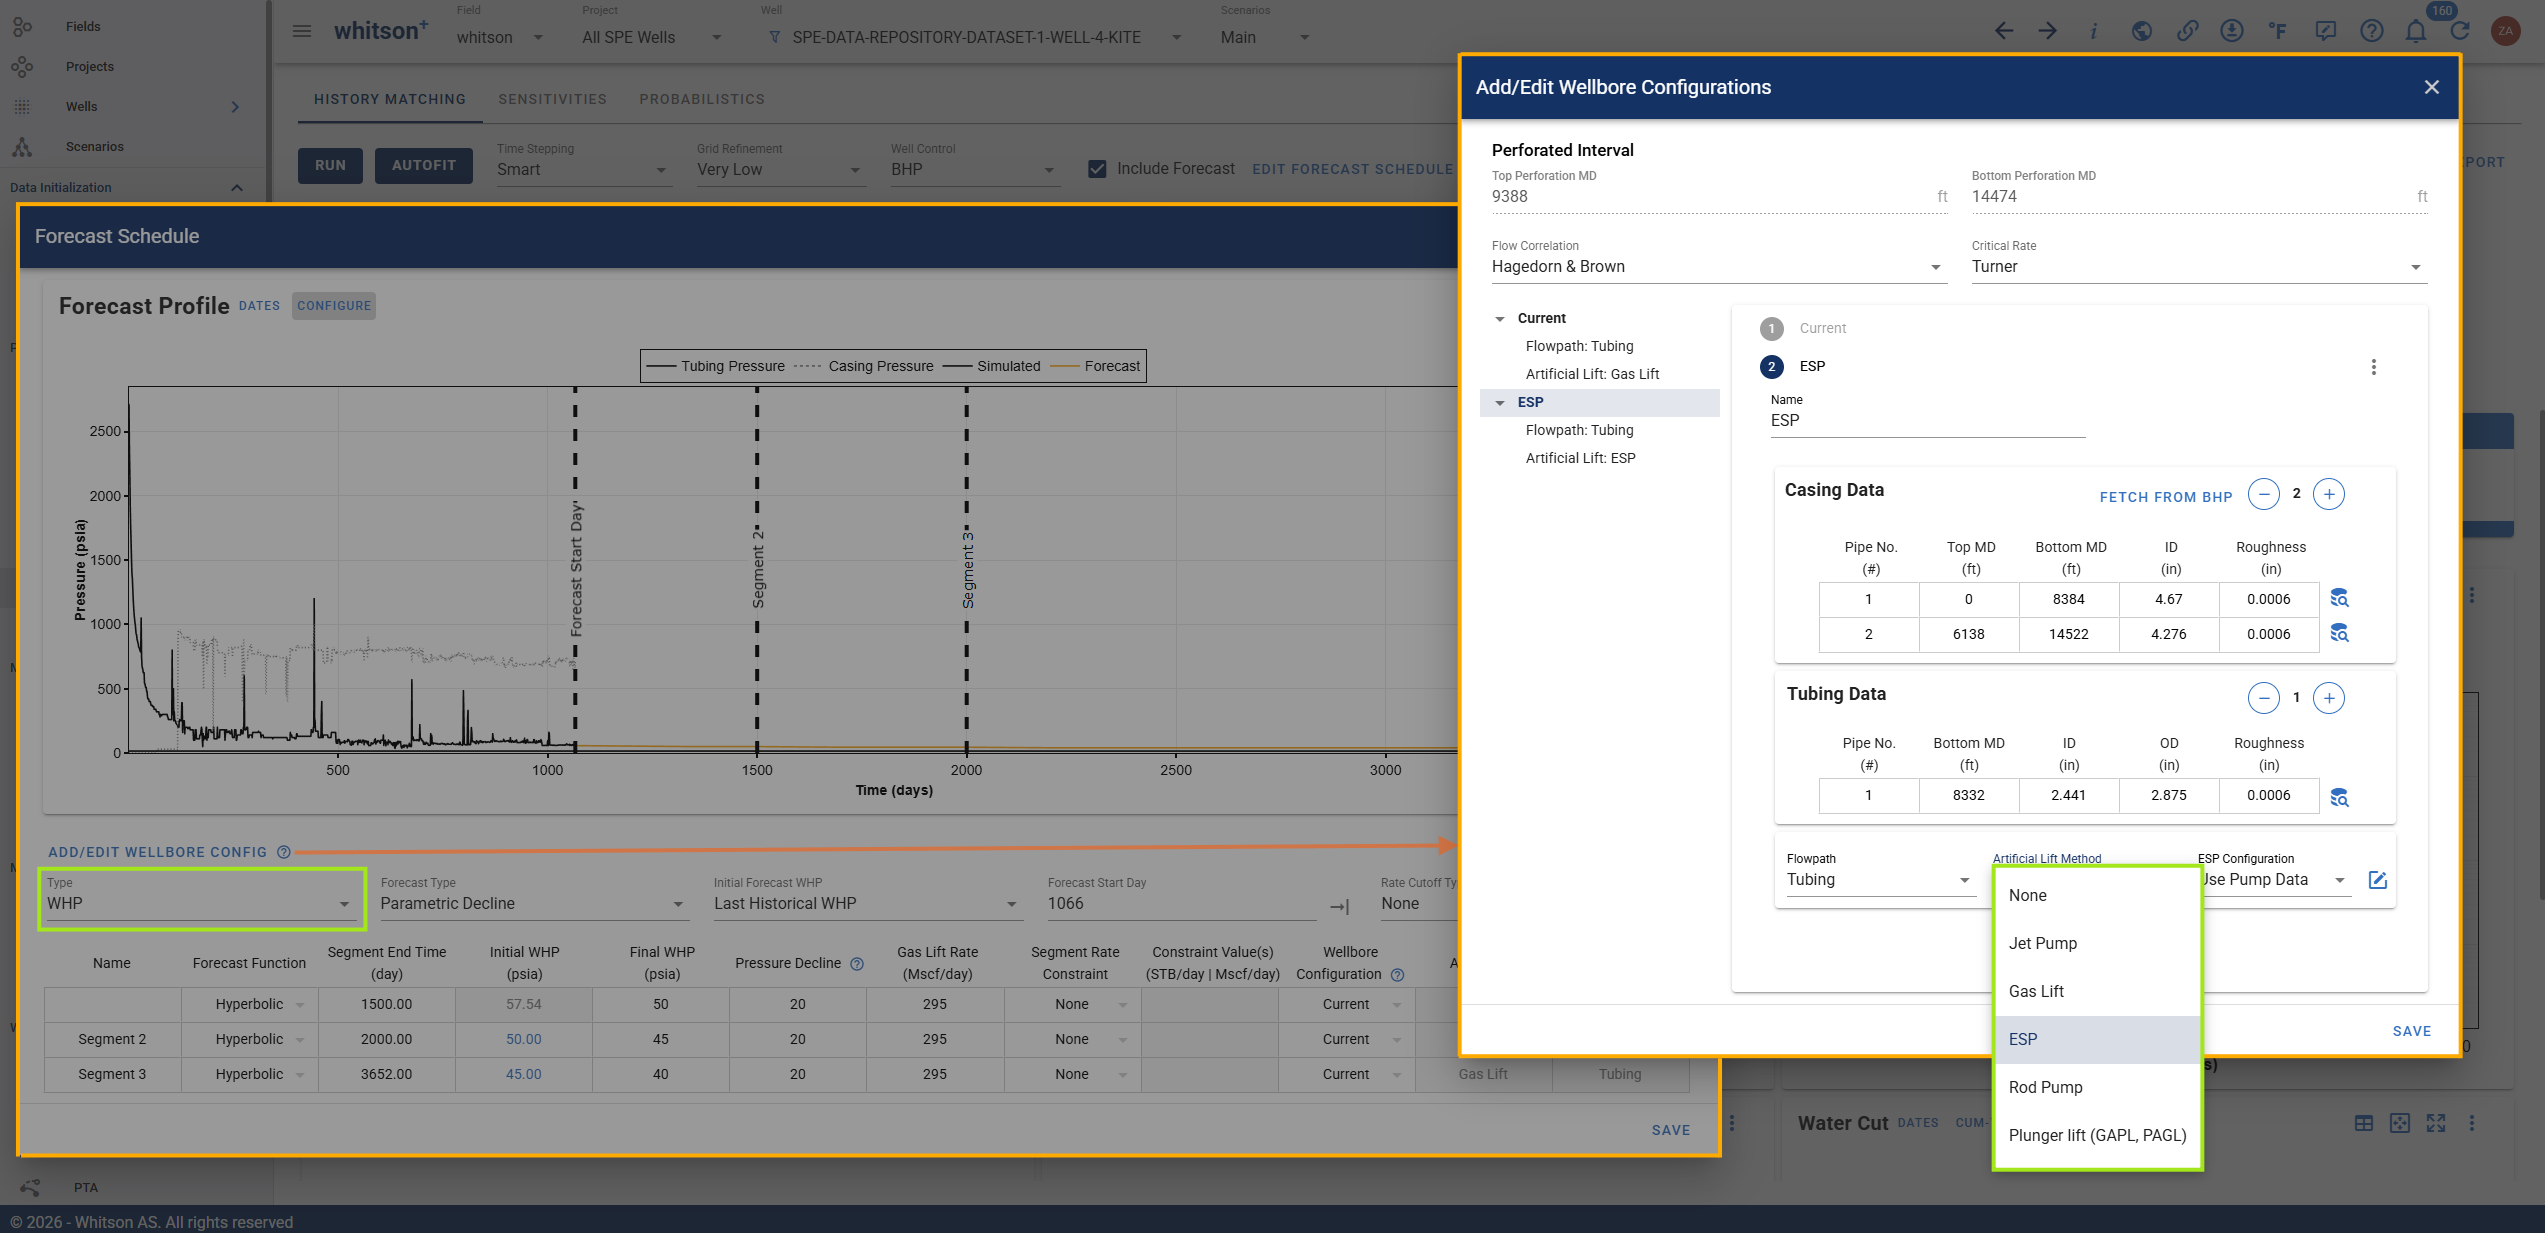
WHP Forecasting, Reimagined: the Wellhead Pressure (WHP) workflow has been overhauled with a more intuitive forecast interface, expanded artificial lift support, and tubing table generation directly within the simulation engine.
-
Build forecasts visually: drag and drop forecast segments to define and adjust the forecast schedule.
-
Explore more artificial lift options: expanded support provides greater flexibility when configuring wellbore conditions for forecasts.
-
Integrated tubing table generation: tubing tables are now generated within the simulation engine, replacing the external generation process.
-
Forecast Manager
-
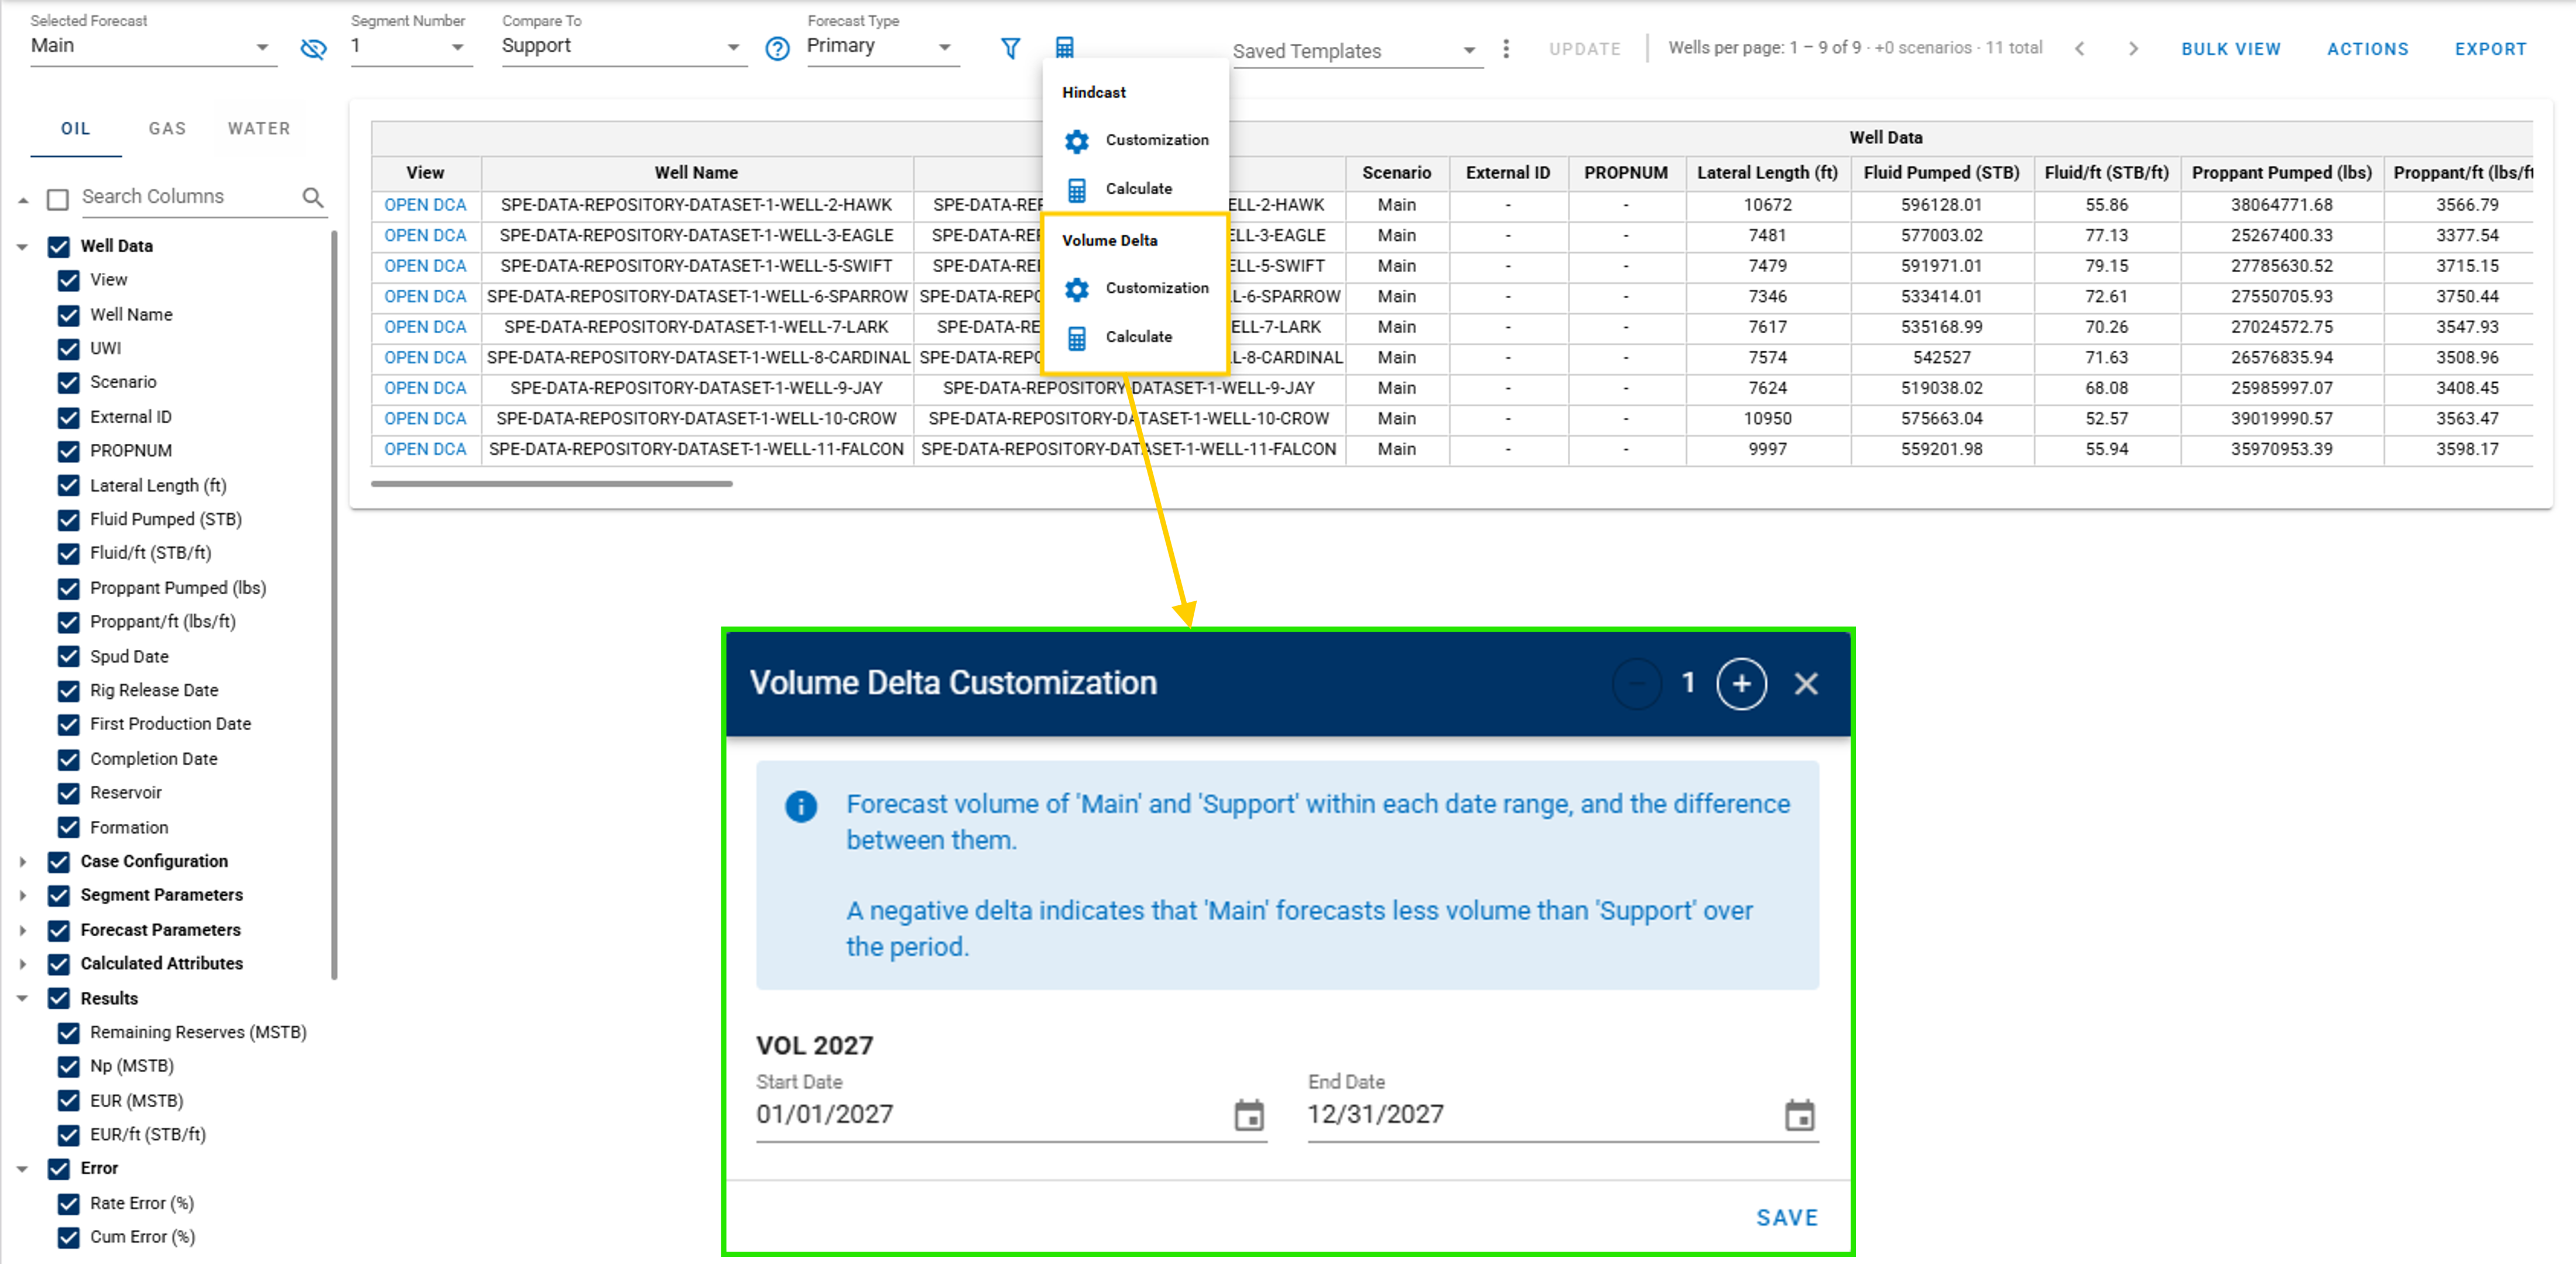
Add Volume Deltas function to the Forecast Manager table for evaluating differences between forecasts over a specific period of time.
-
Forecast Manager table can now display well scenarios when either the Scenario column or a Scenario filter is enabled.
Auto-Forecast and Group Forecasting
-
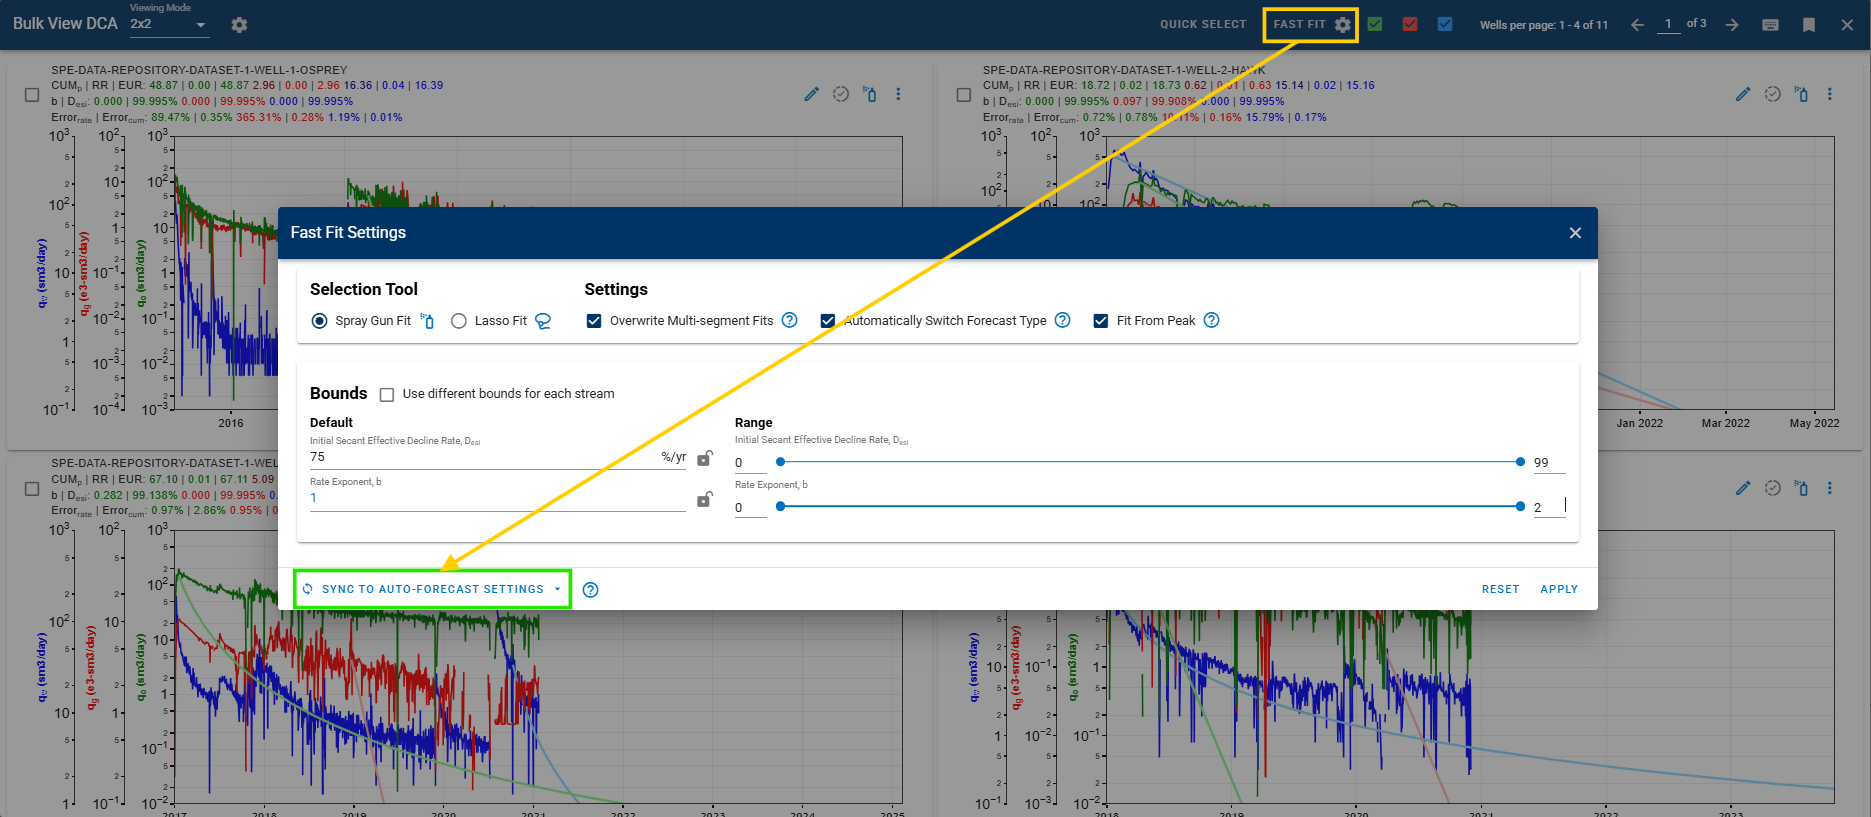
Sync Fast Fit Settings in bulk view auto-forecast to auto-forecast settings for more consistent fitting behavior between workflows. It will overwrite the fast fit bounds with the current auto-forecast settings or a saved auto-forecast template.
-
New Fit Basis: Rate vs Cum, fitting forecasts in rate-cumulative space (works only with Modified Arps autofit type).
-
Match EUR using Custom Attributes: users can use custom attribute values as the target EUR when performing Auto-Forecast.
-
Expand Transient Hyperbolic autofit functionality with Decline Rate handling.
-
Add a new forecasting sequence combining Linear Decline + Constant segments: autofits two segments, a declining linear segment until a minimum ratio constraint, then a constant segment.
-
Add new Daily Rates, Monthly Volumes, and Monthly Average Daily Rate export options for Group Forecasting.
Type Well
-
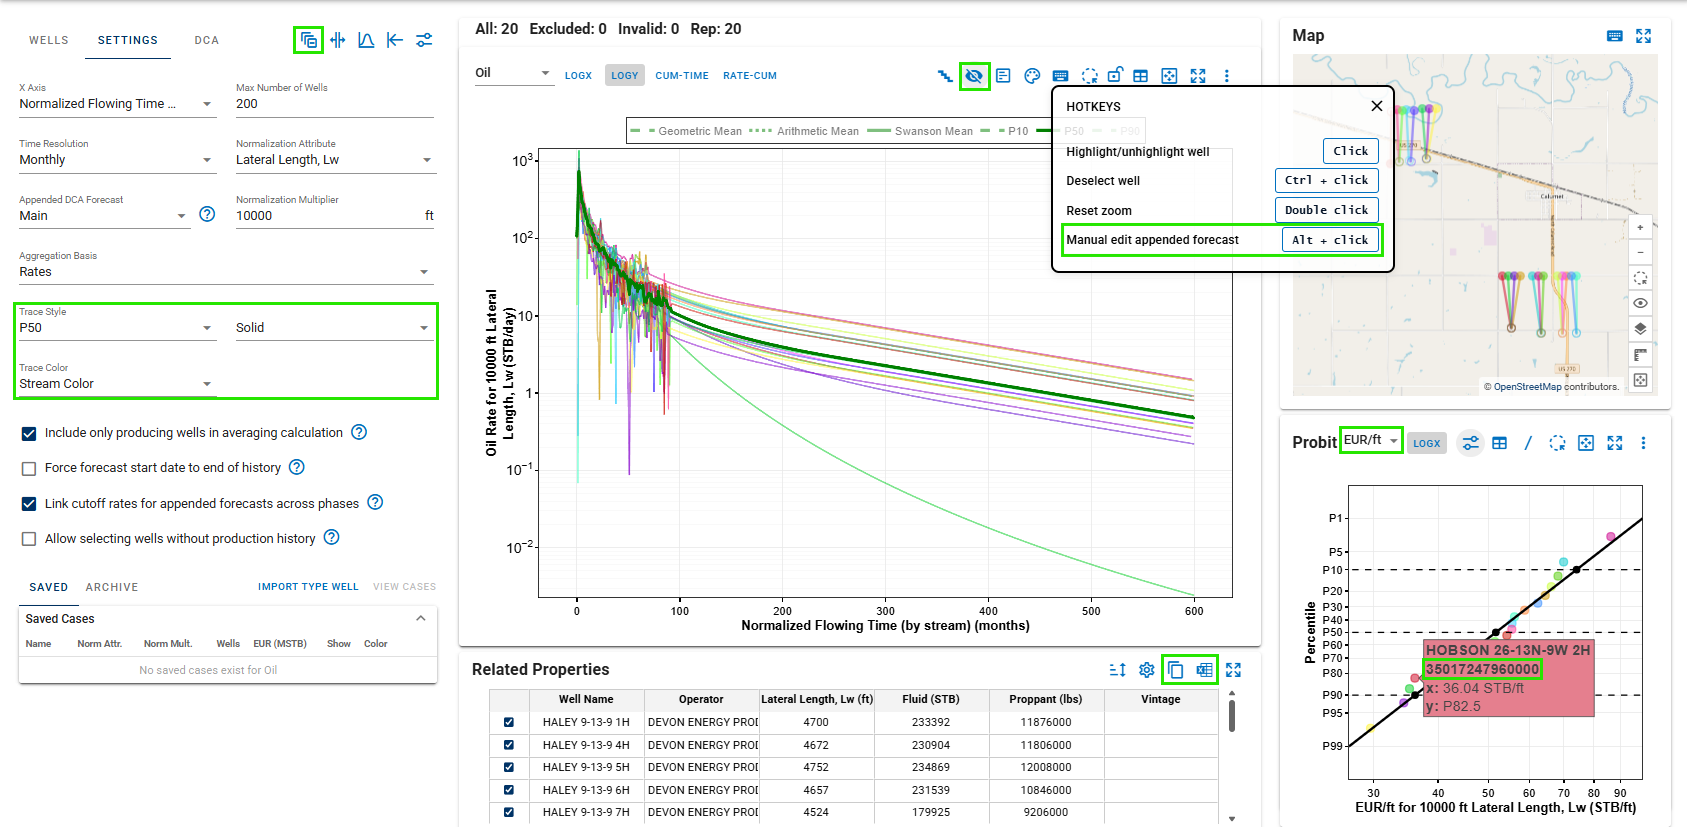
Type Well receives a significant set of workflow, visualization, and export enhancements:
-
Alt + Click can now be used to manually edit appended forecasts directly from the plot.
-
Customize individual type well traces using Trace Style and Trace Color.
-
Add EUR/ft to the Probit plot.
-
Include UWI in the Probit plot hover information.
-
Single-click a point in the Probit plot to highlight the corresponding well.
-
Save settings configured through Customize Plot for later reuse.
-
Add an eye icon for showing or hiding filtered-out wells on the map.
-
Add a color-indicated legend to the Type Well map.
-
Add Copy Table and Export to Excel functionality for the Related Properties table.
-
Add reusable Type Well templates.
-
-
Type Well Manager:
-
Add an editable Max Type Well Life column to the table.
-
Add new export types: Daily Rates, Monthly Volumes, Monthly Average Daily Rate, and Excel.
-
Add additional PowerPoint export template options for type well results.
-
Add Project/Area import functionality.
-
Comparison Plot
-
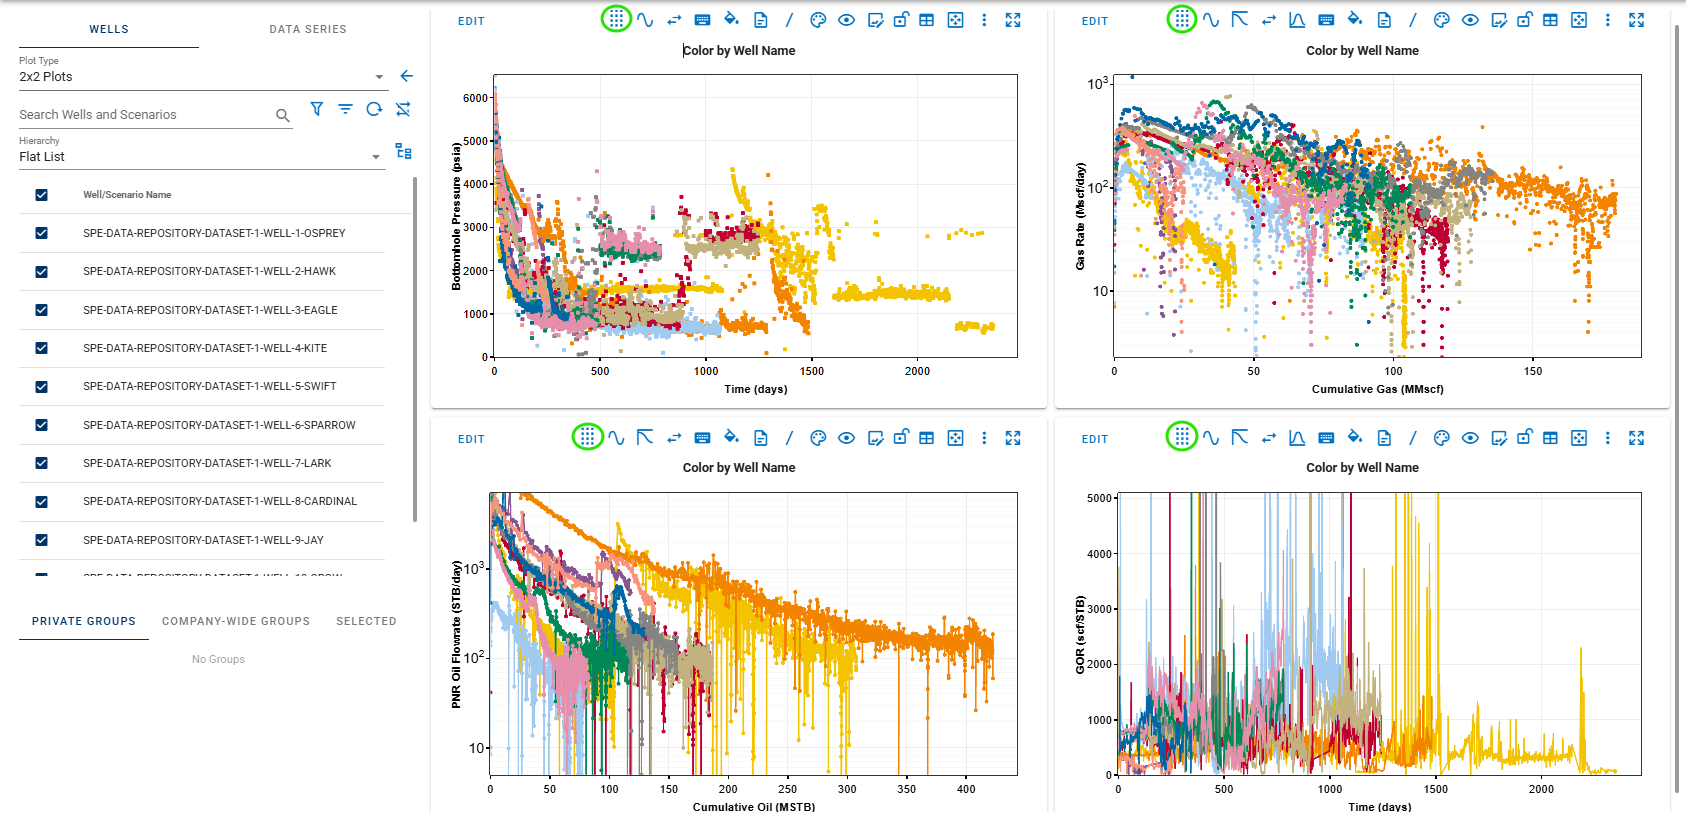
Add the ability to move and rearrange plots within the 2×2 plot layout, providing greater flexibility when organizing Comparison Plot views.
-
Enhance Comparison Plot to support multiple DCA forecasts and aggregated forecasts separately, providing greater control over how forecast cases are displayed and compared.
General
-
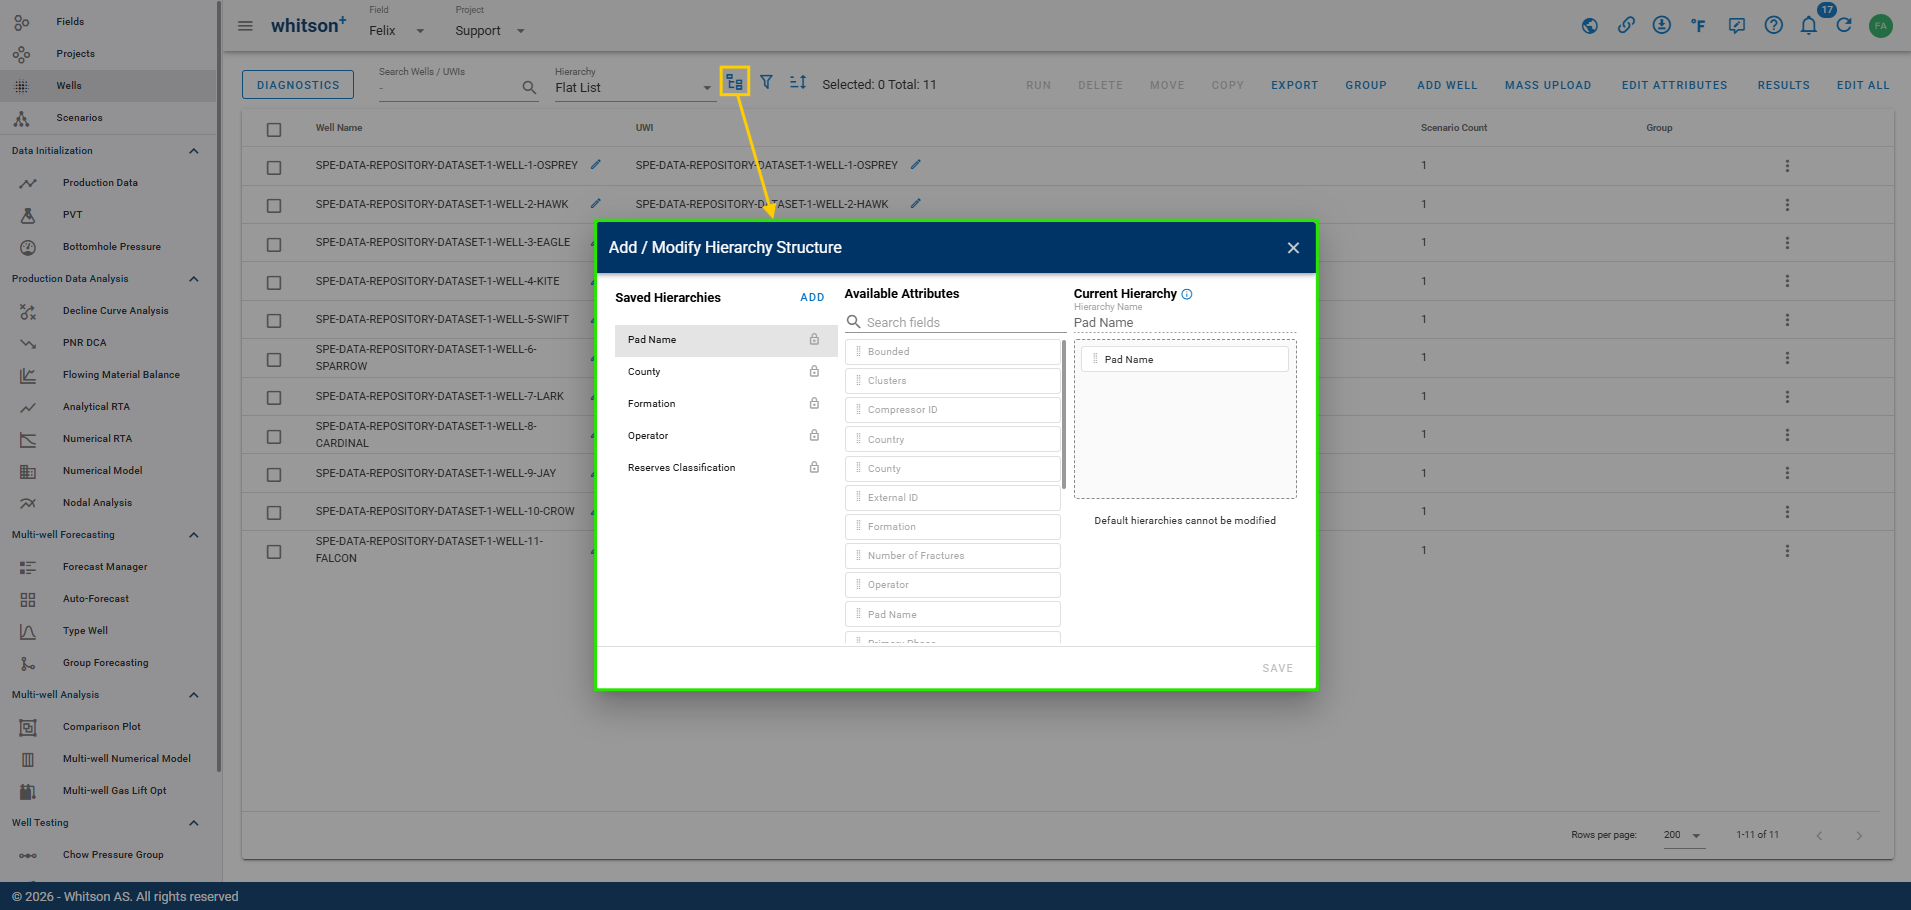
Introduce the new Hierarchy functionality across the software. The attribute order in the hierarchy will define the tree levels.
-
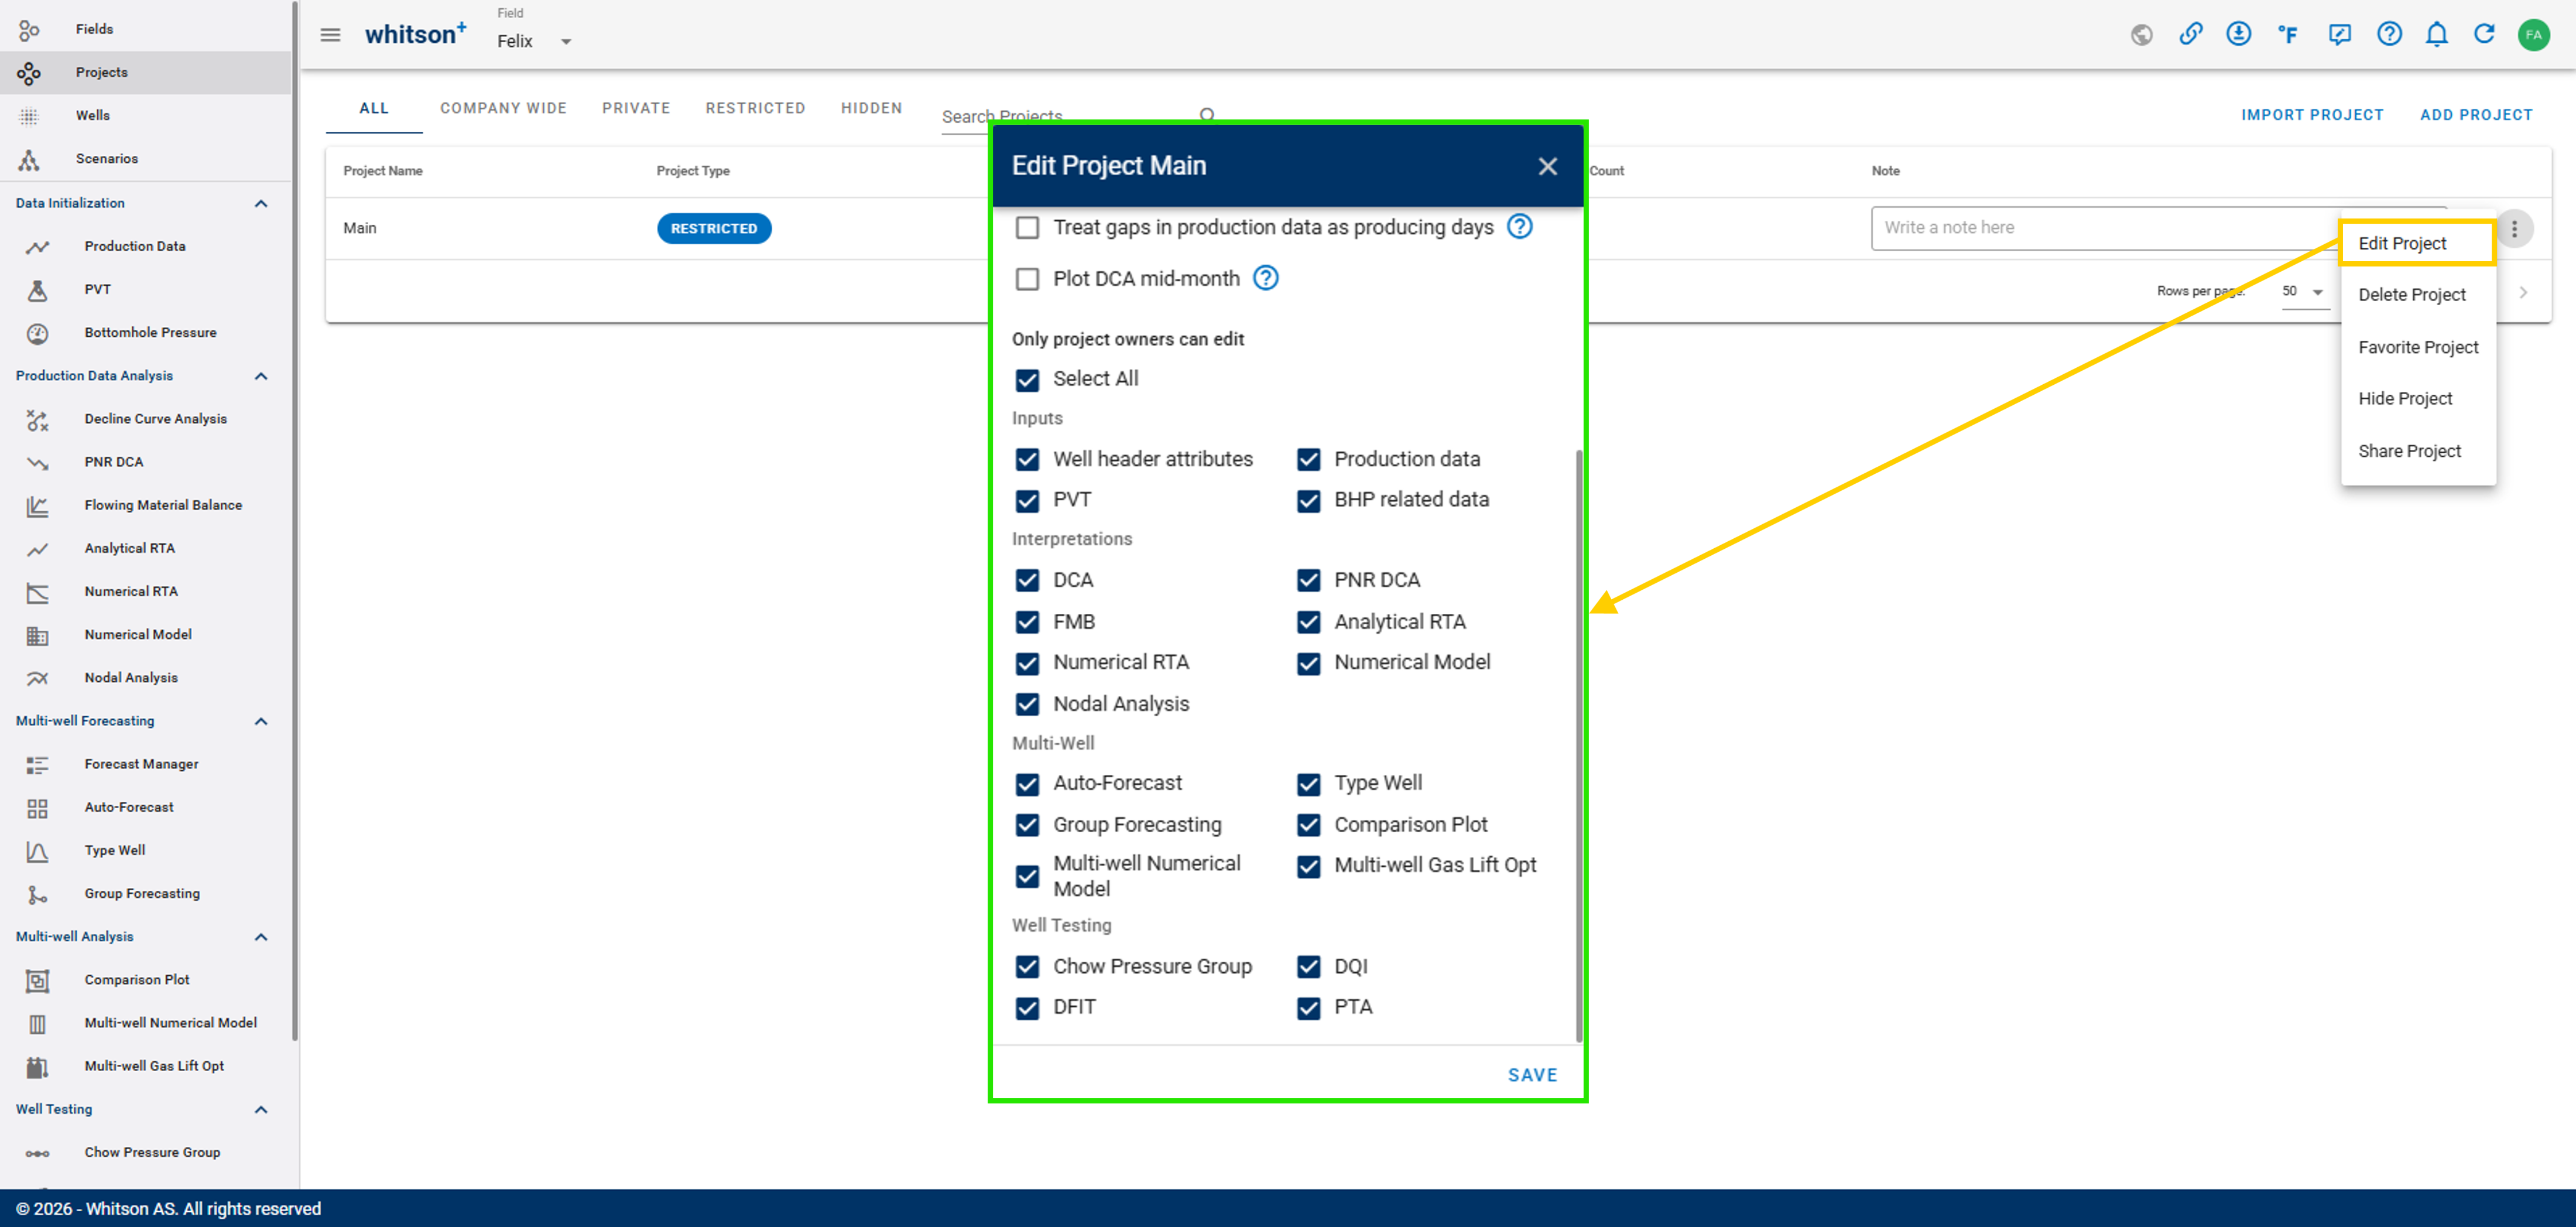
New Restricted Project/Scenario functionality: project/scenario owners can now restrict editing for selected data and workflows. Restrictions can be configured to Inputs, Interpretations, Multi-Well, and Well Testing.
-
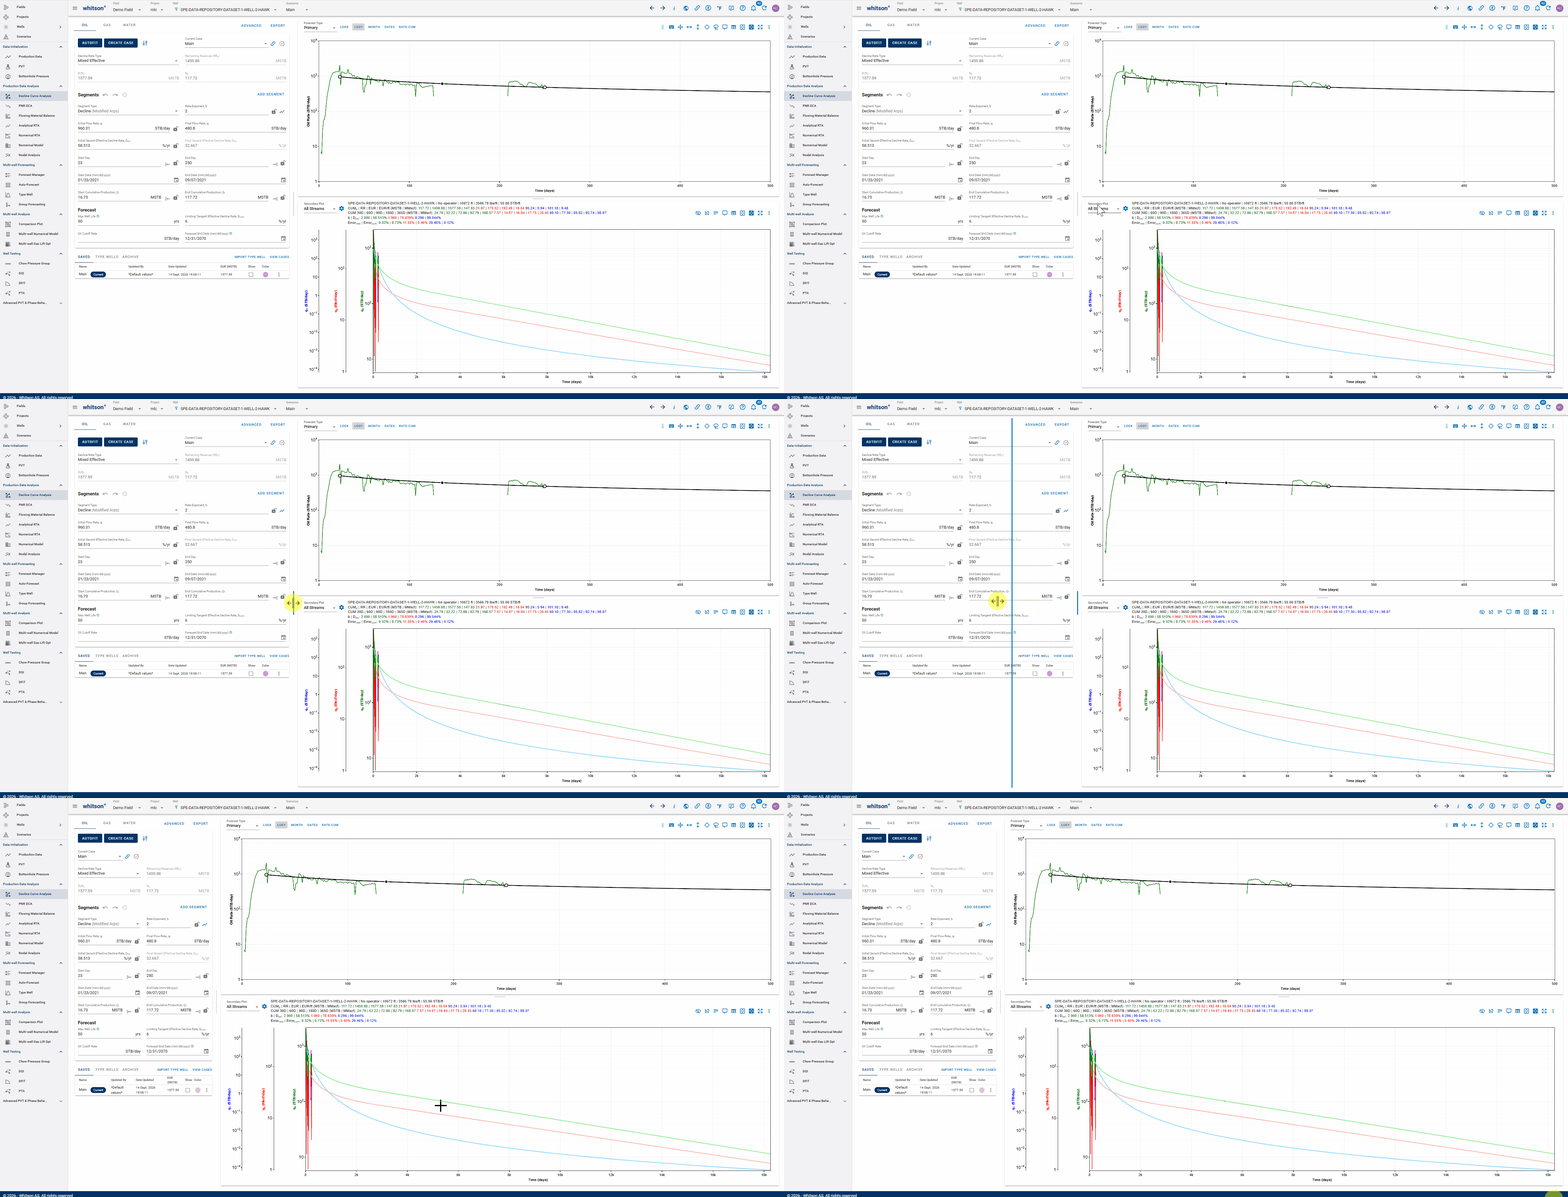
Resizable analysis panel: users can now drag the divider between the input/analysis panel and plotting area to resize the panels horizontally. This provides more flexibility to allocate screen space between inputs and plots across modules.
-
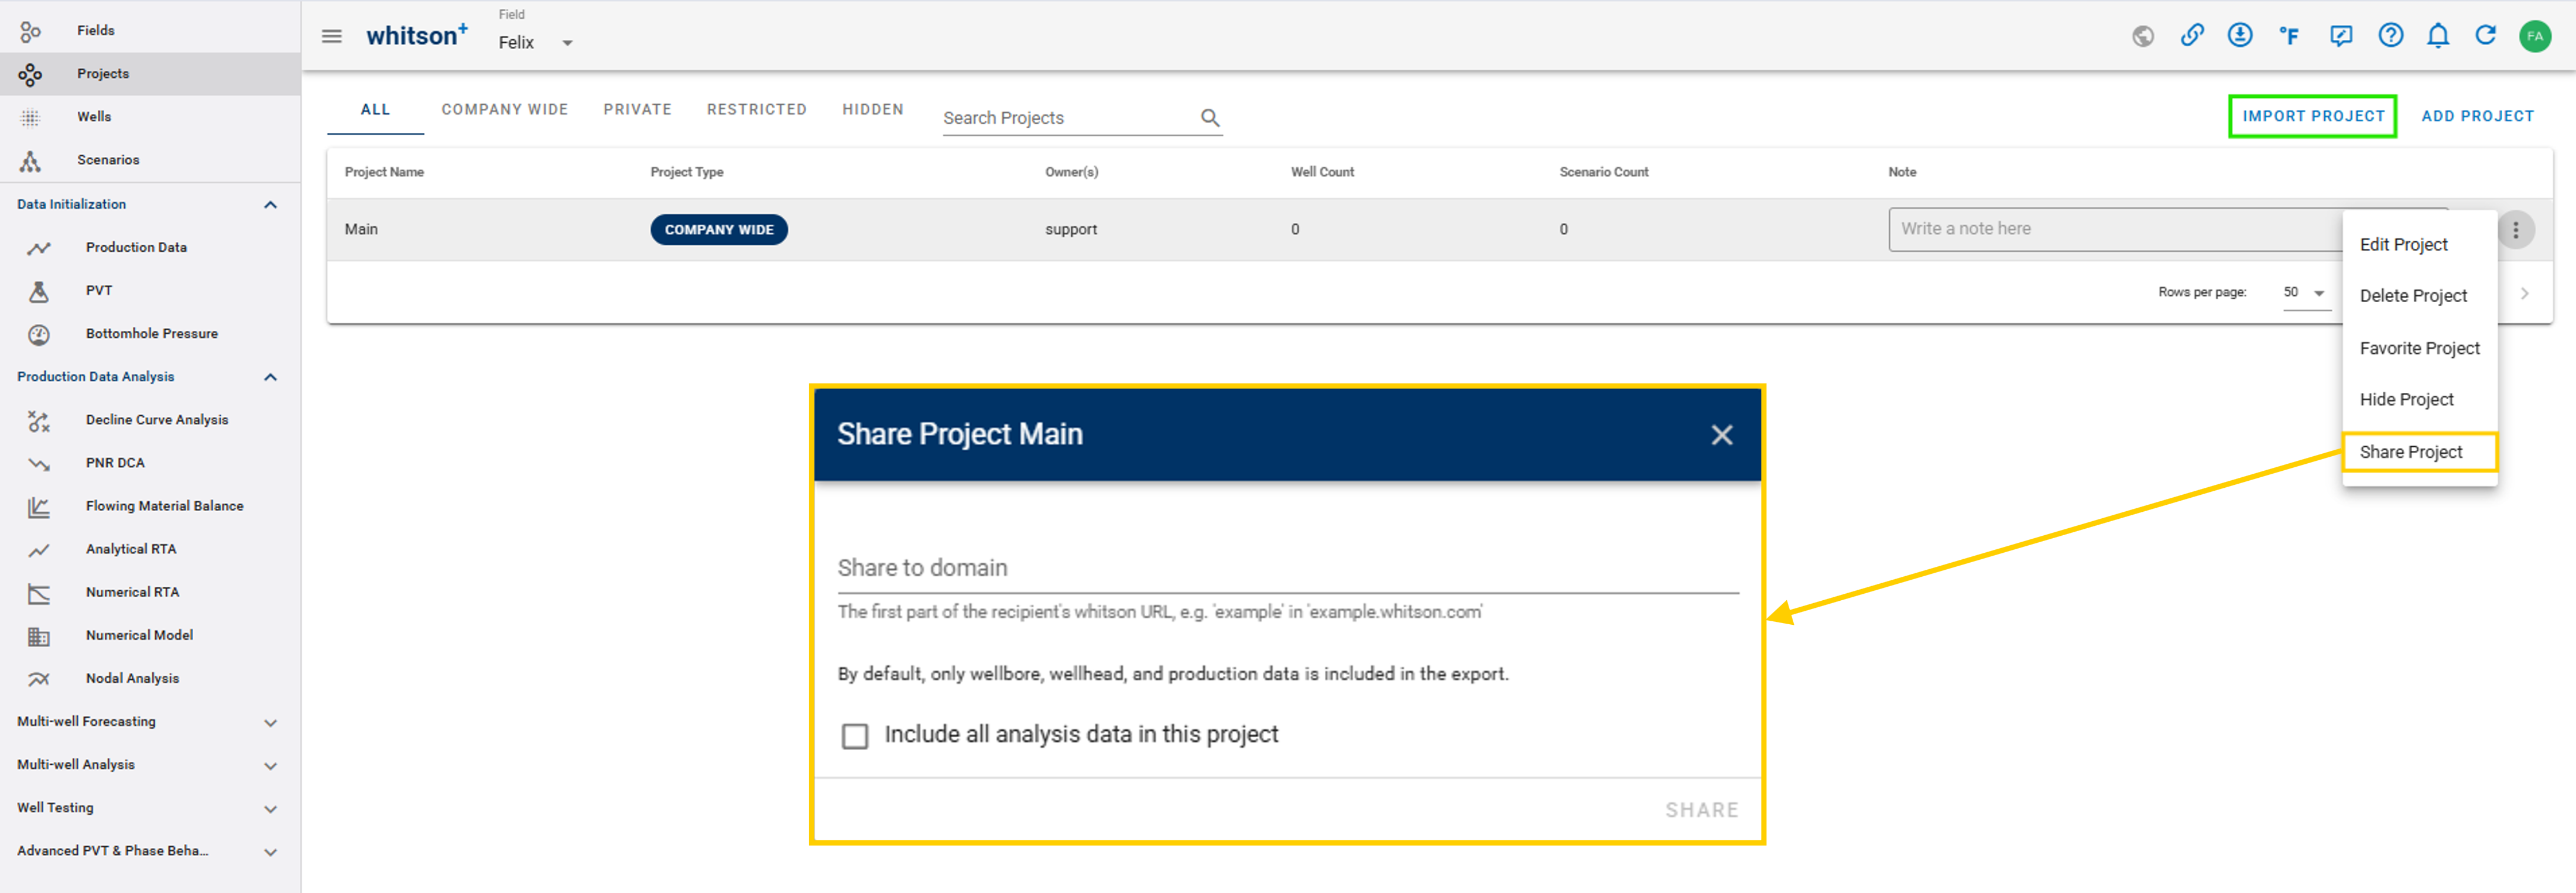
Project Import/Export between domains: add functionality for sharing projects across whitson+ domains. Users can import a project key that has been shared from another whitson+ domain, improving collaboration and project transfer between separate domain environments.
-
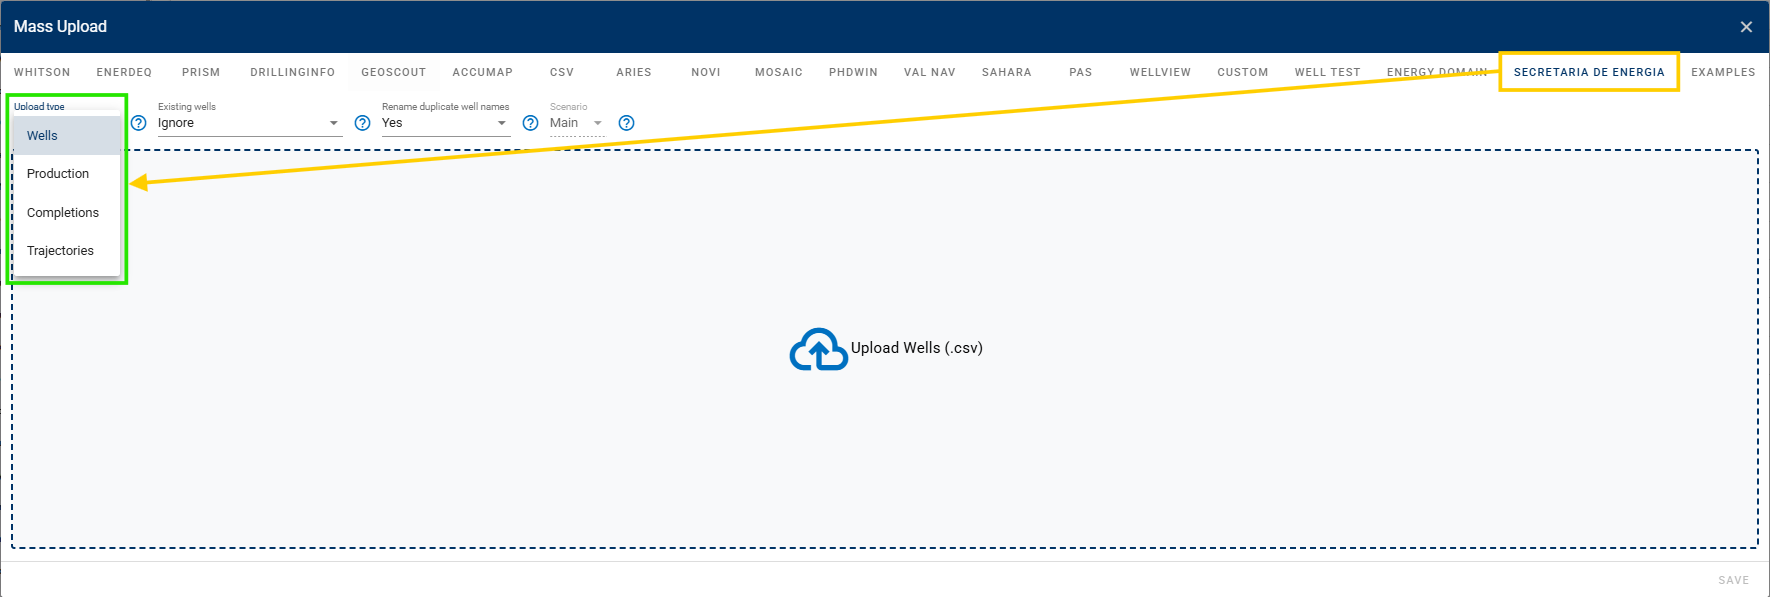
Introduce a new general mass upload system with support for multiple data providers and file formats, including:
- Enerdeq
- PRISM
- Drillinginfo
- geoSCOUT
- ARIES
- Novi
- Custom
- Secretaría de Energía
-
Upgrade the Secretaría de Energía uploader to support four datasets: Wells, Production, Completions, and Trajectories data.
-
ARIES mass upload now supports multiple qualifiers within the upload workflow.
-
Add new columns to Results and Well Info exports:
- BHP: Calculation Status
- Numerical RTA: and
- Production Comments: Date and Comment
-
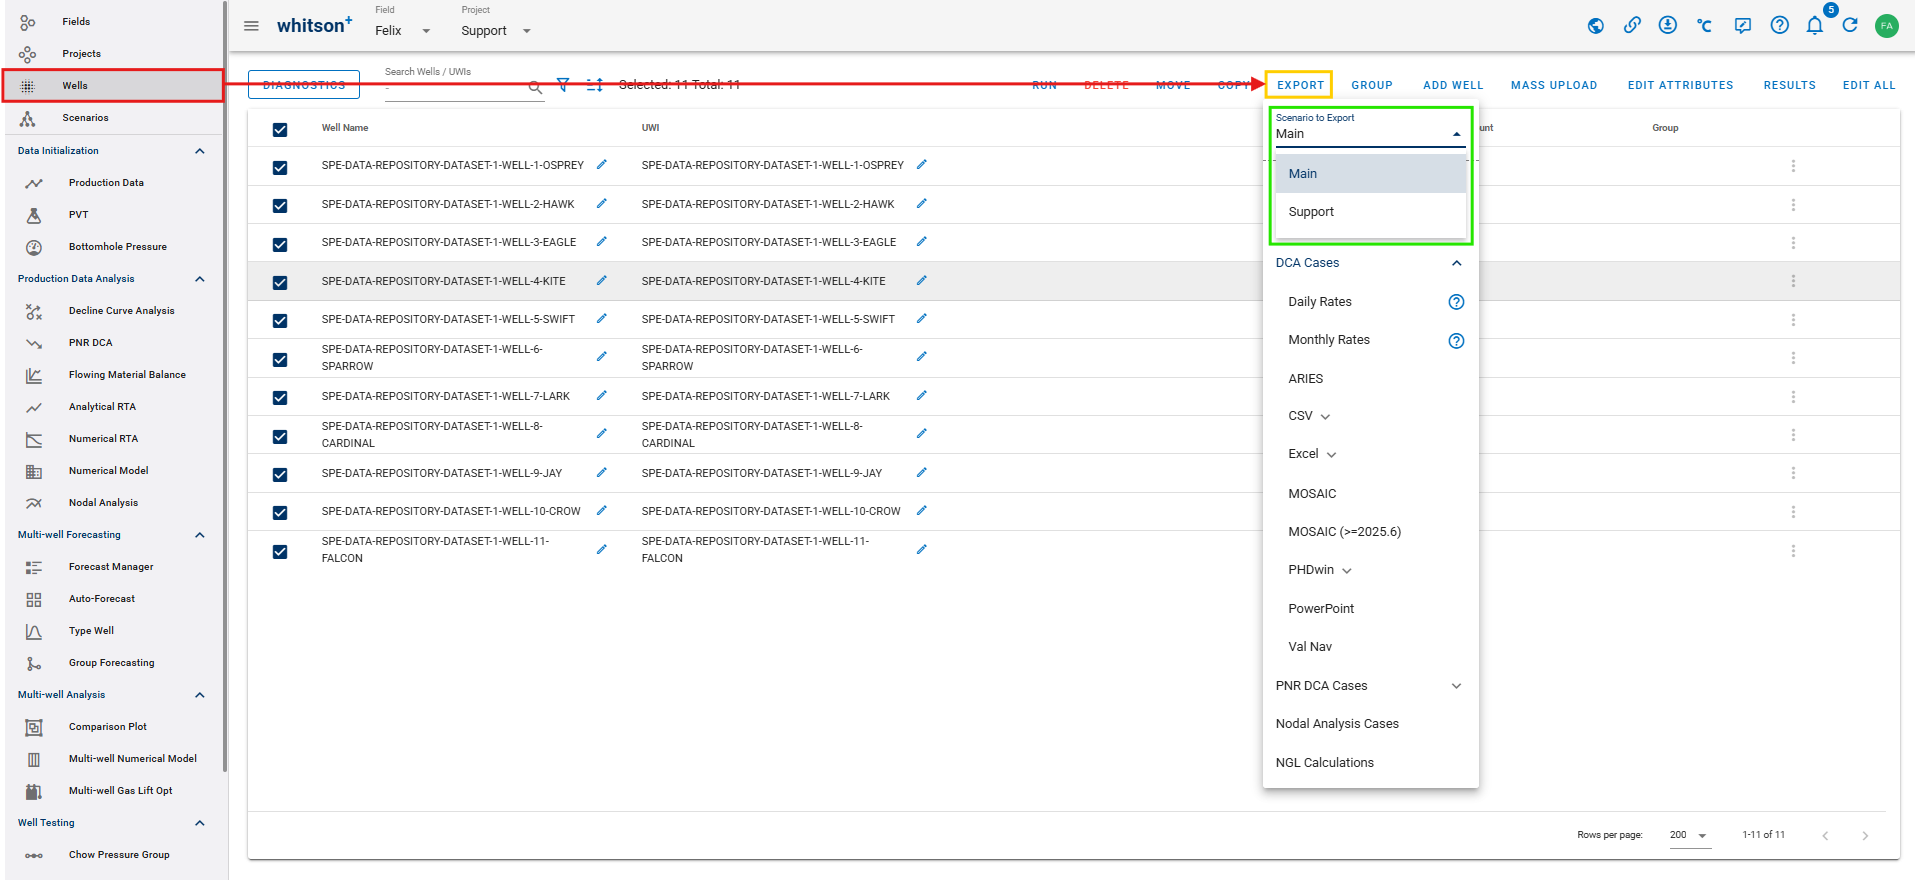
Users can now select the scenario used for bulk exports from the Wells page.
-
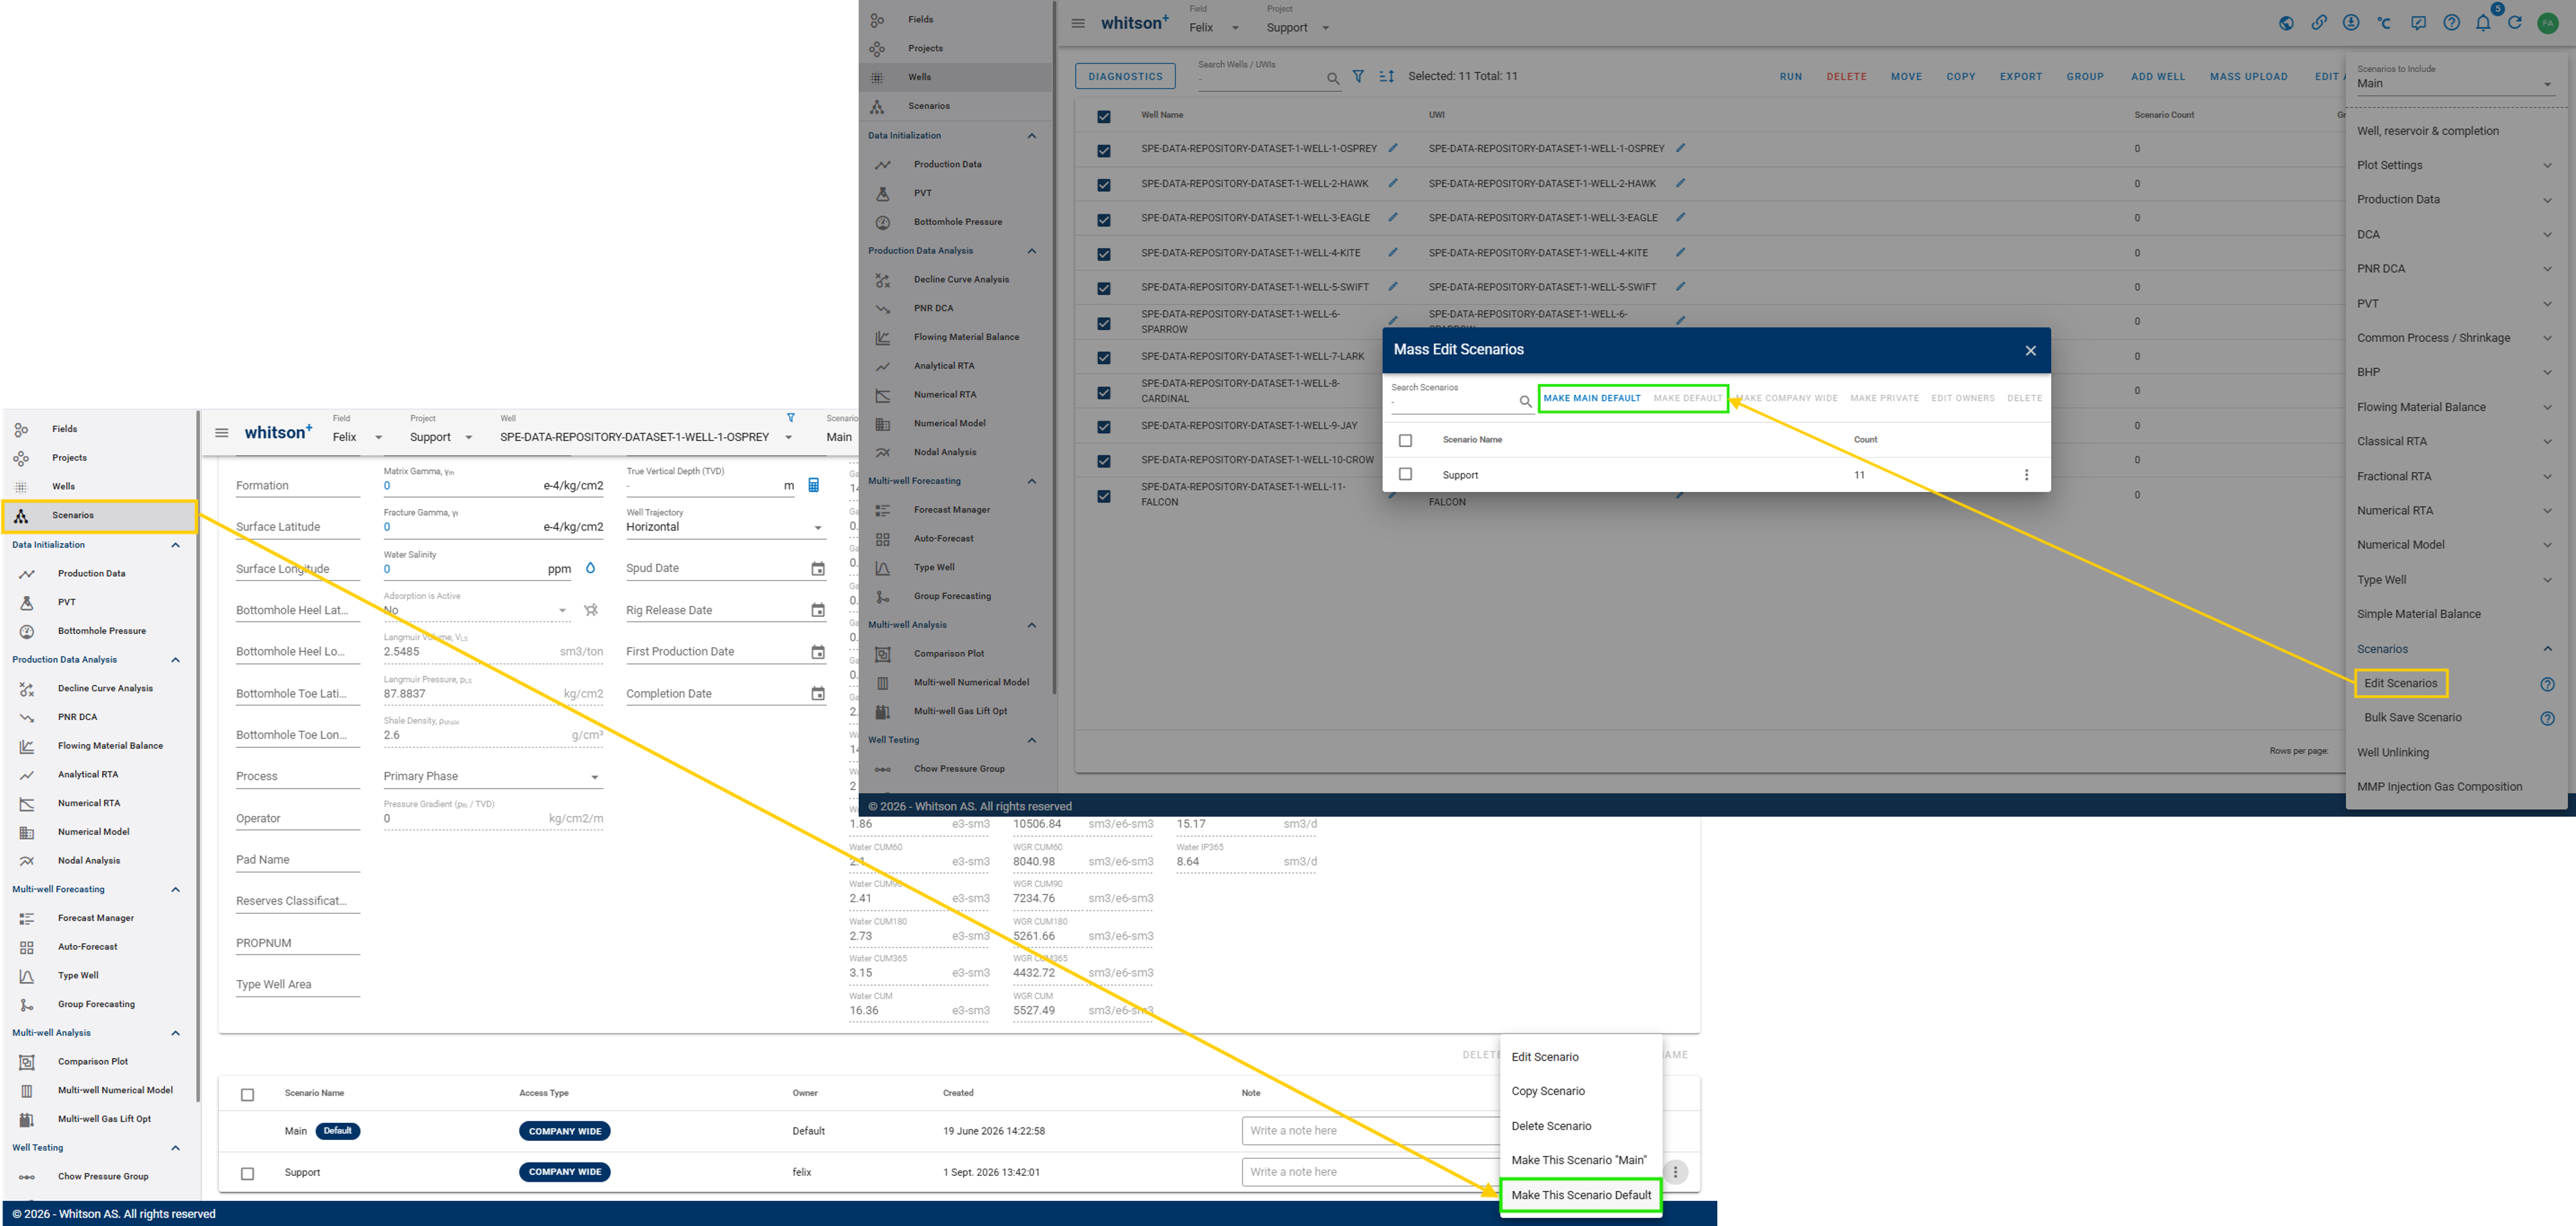
Add the ability to define a default scenario per user.
-
Linked-well tooltips now provide additional information and allow users to navigate directly to the source well.
-
Add annotation text-size controls to customize the plot.
Filtering / GIS Map / Color by Attribute
-
Well-table filtering now supports:
-
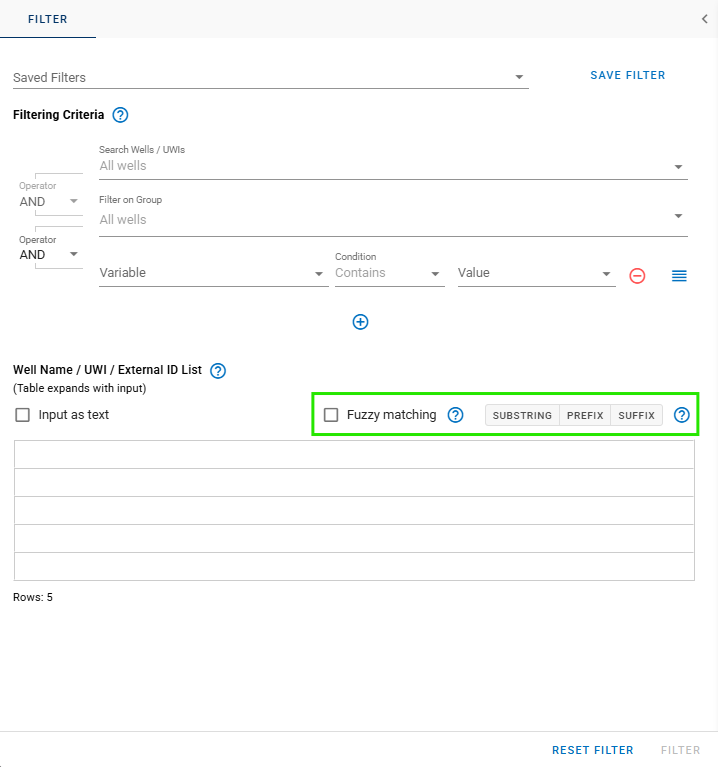
Fuzzy matching: matches wells even if the Well Name, UWI, or External ID isn’t typed exactly. Useful for partial values or typos.
-
Matching condition: where the value must appear – Substring anywhere, Prefix at the start, or Suffix at the end. Leave unselected to require the full Well Name, UWI, or External ID.
-
-
Add Missing and Not Missing filter conditions.
-
Add new variables for filtering:
- Shapefile Attribute
- Group
- Classical RTA – Intercept
- Classical RTA – Lock Intercept
-
Well/UWI searches now support fuzzy searching.
-
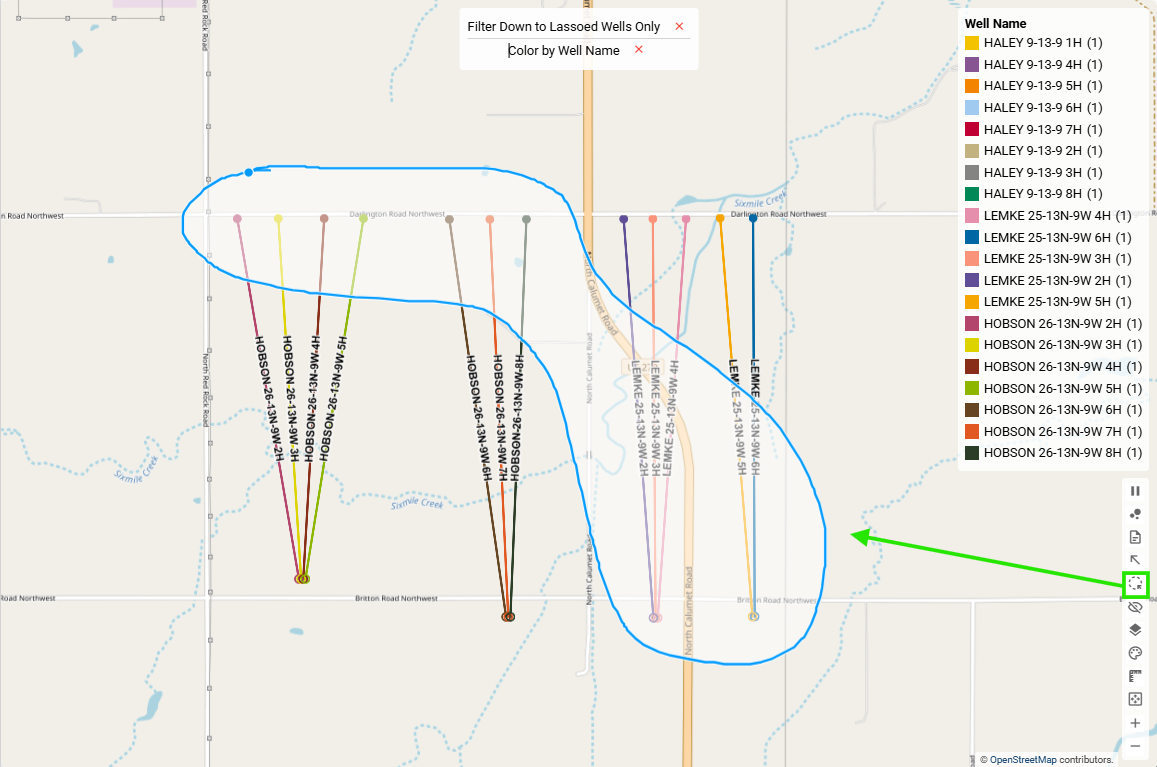
Lasso selections can now target a specific well location: Head, Heel, or Toe.
-
Add Color by Shapefile, enabling users to color-code shapefile polygons and configure their opacity based on shapefile attributes.
-
Add an option to hide shapefile borders.
-
Saved filters can now include the current lasso selection.
-
The Color by Attribute workflow has been substantially upgraded:
-
Save configured ranges for later editing.
-
Add an Advanced Settings dialog:
- Add an overall minimum/maximum cap to reduce the influence of outliers.
- Add logarithmic range splitting.
- Add configurable color schemes for both discrete ranges and gradients.
-
Option to link a Range Name to its minimum and maximum values.
-
Preserve custom properties such as range name and color when splitting ranges.
-
Simplify string-attribute ranges by removing irrelevant value and min/max columns.
-
Display the well count associated with each range as a new column.
-
Highlight ranges containing no wells in red.
-
Type Well legends now:
- Hide traces corresponding to ranges with no wells.
- Follow the configured range order.
-
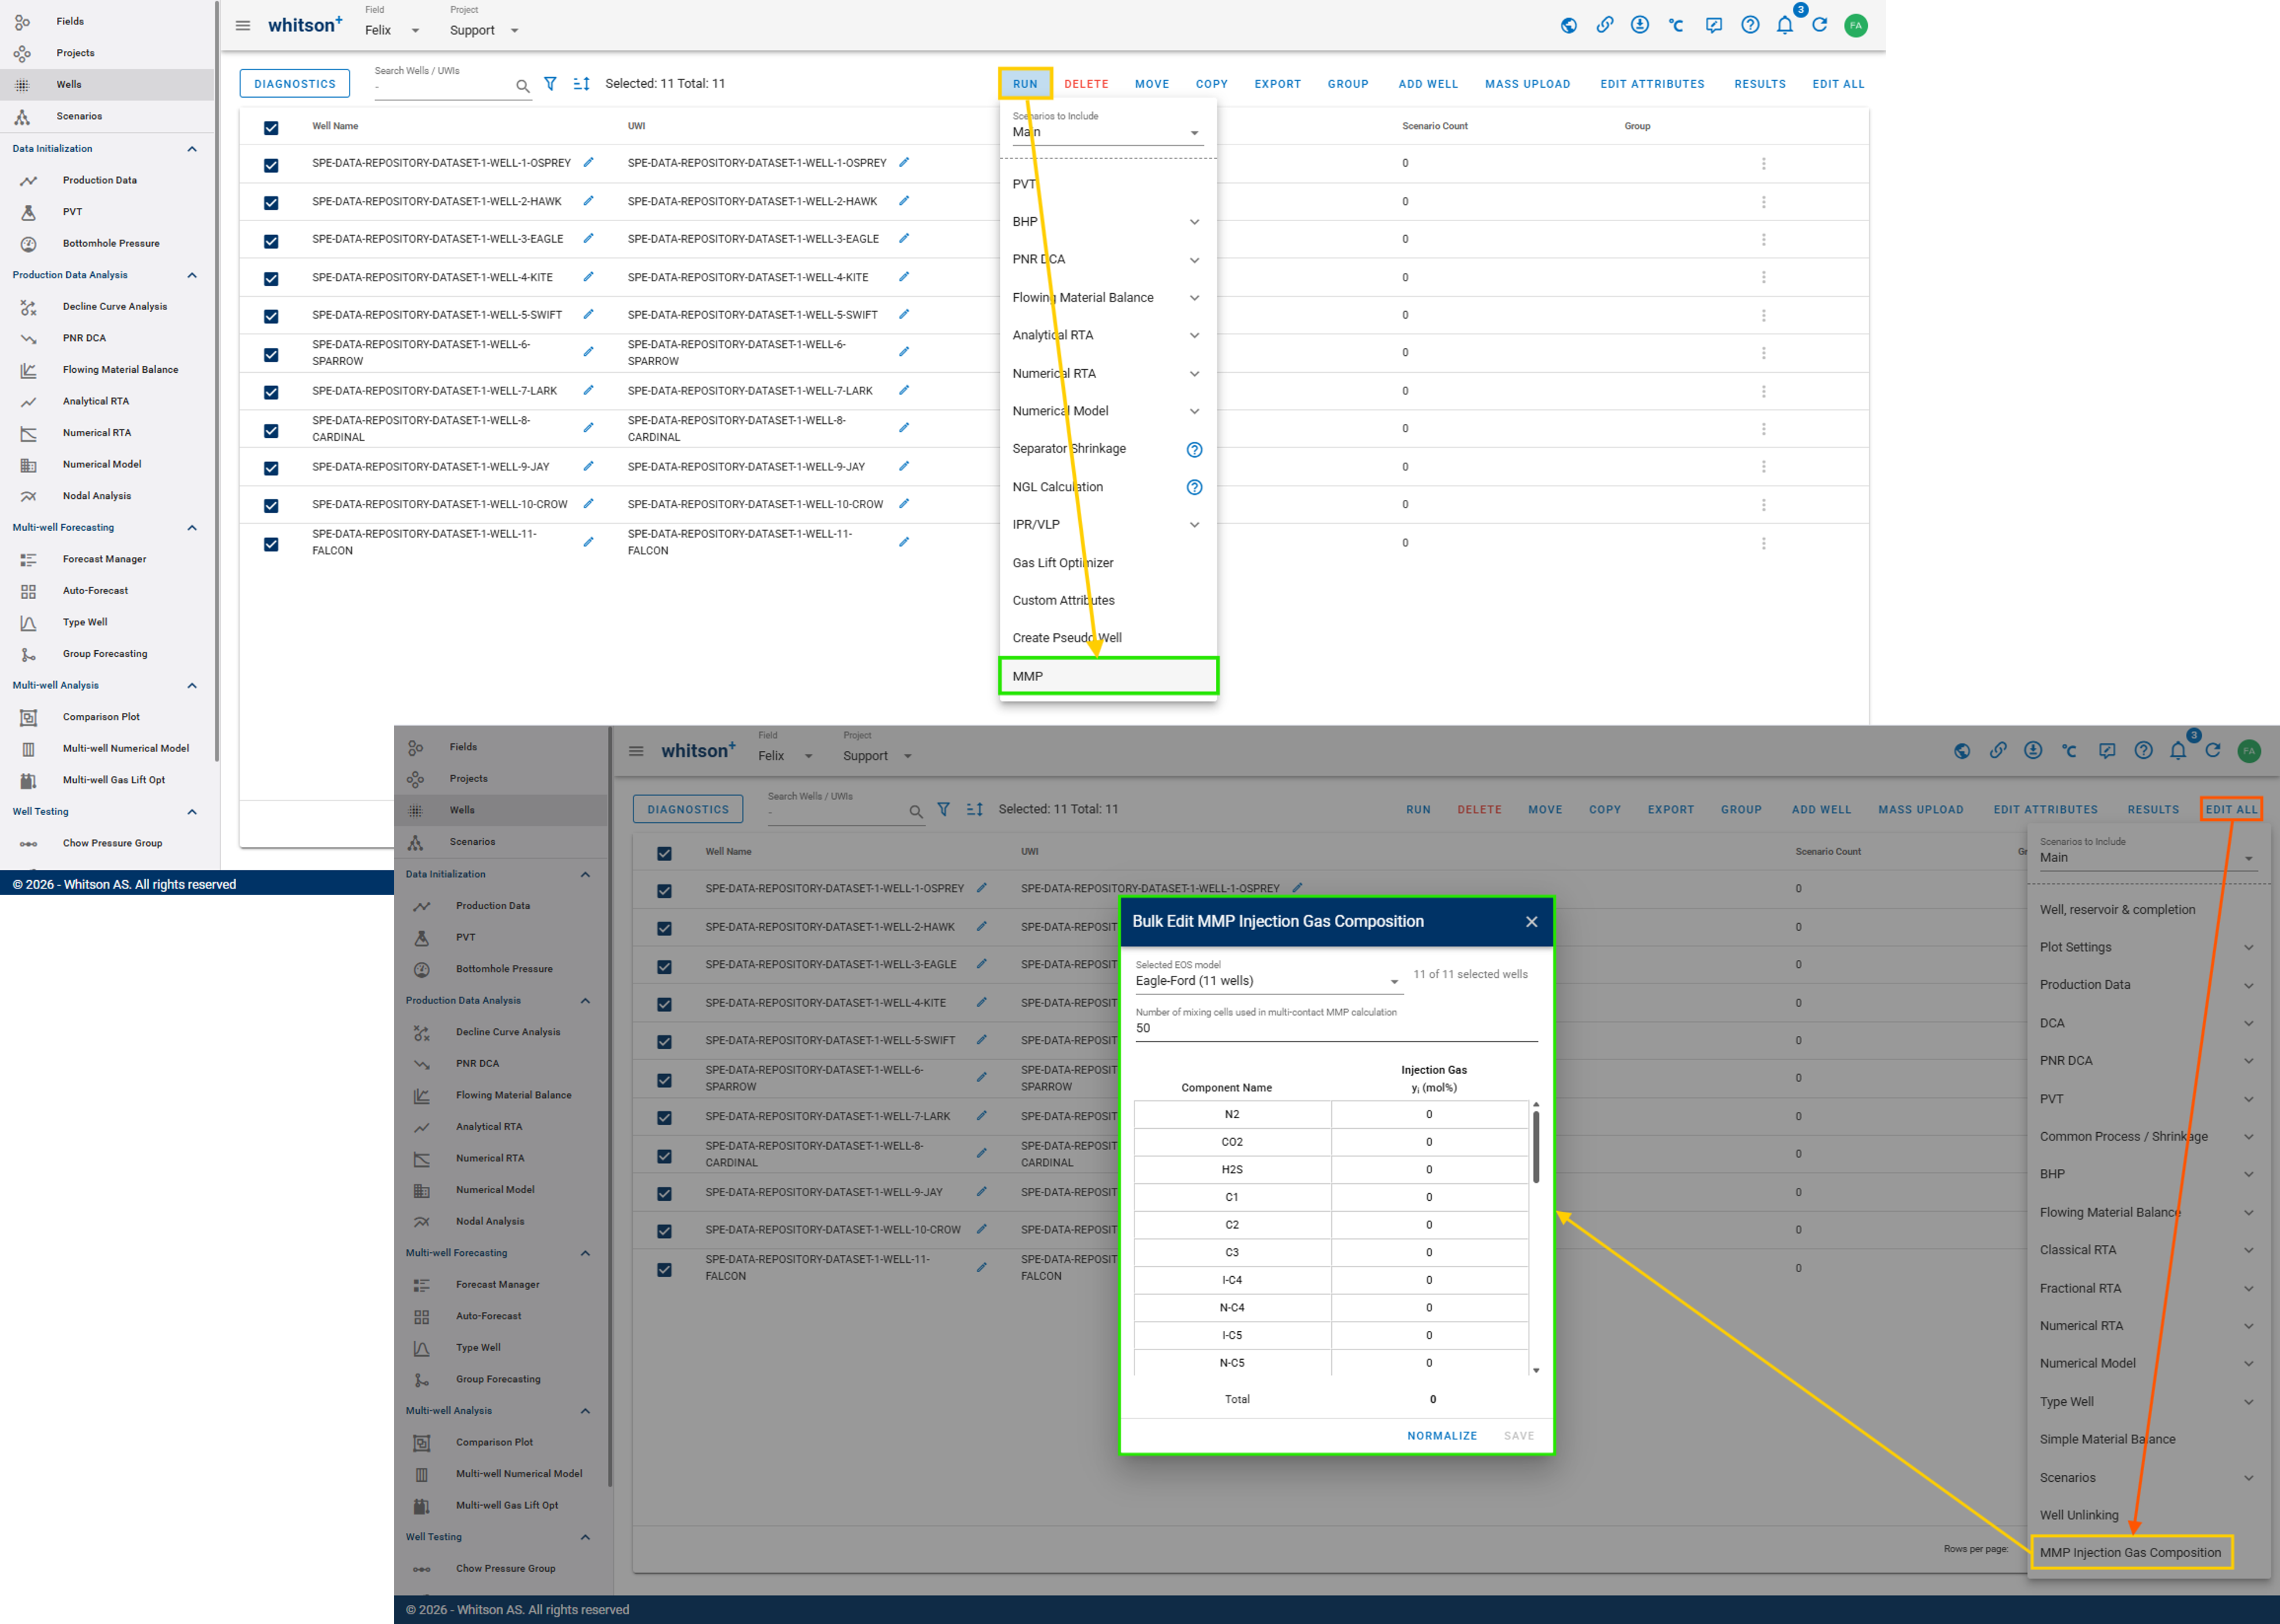
Virtual PVT Lab / Gas EOR PVT