Production Data - Monthly Data
This page goes through the details of working with monthly data.
When Should I Use the "Supplemental Monthly Data" Tab?
The Supplemental Monthly Data tab is intended for co-visualization within decline curve analysis (DCA) workflows. Users should use this tab when they want to overlay additional rate data—such as monthly oil, gas and water rates —on top of the main production dataset to assist with visual interpretation while generating DCAs, type wells or auto-forecasts.
- The software works perfectly with monthly production data entered in the main Production Data tab. There is no need to use the Supplemental tab for this purpose. The Supplemental tab is there to help you visually compare or overlay secondary data streams during DCA workflows.
It is important to note the following:
- Only rate data can be entered here (no pressures).
- The official production data must still be entered in the Production Data tab for it to be included in modeling workflows.
This tab exists purely to give engineers enhanced visual context during decline analysis—it is not a substitute for production data entry and is not used for any calculations.
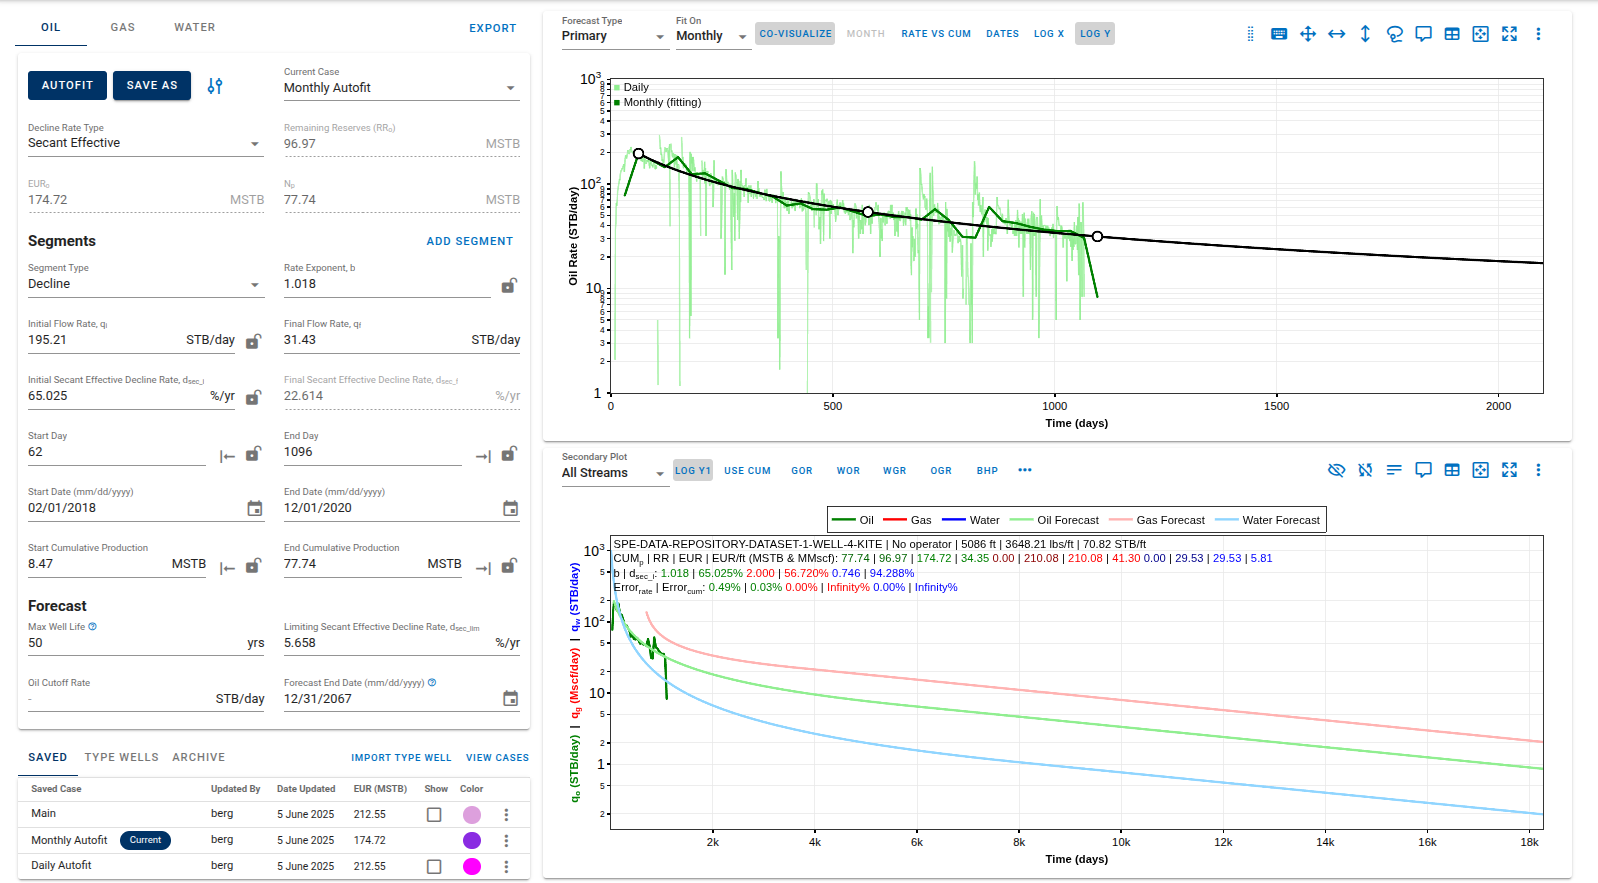
The monthly data can also be used to influence the calculations in DCA.
If "Fit On" is selected to be monthly, the autofit will use monthly data in the fitting algorithm rather than daily.
Note
The historical cumulative production could potentially be different when fitting on monthly as well.
Overview
The software allows manual editing of all monthly data input. Users can view, enter, or adjust monthly measurements directly in the platform.
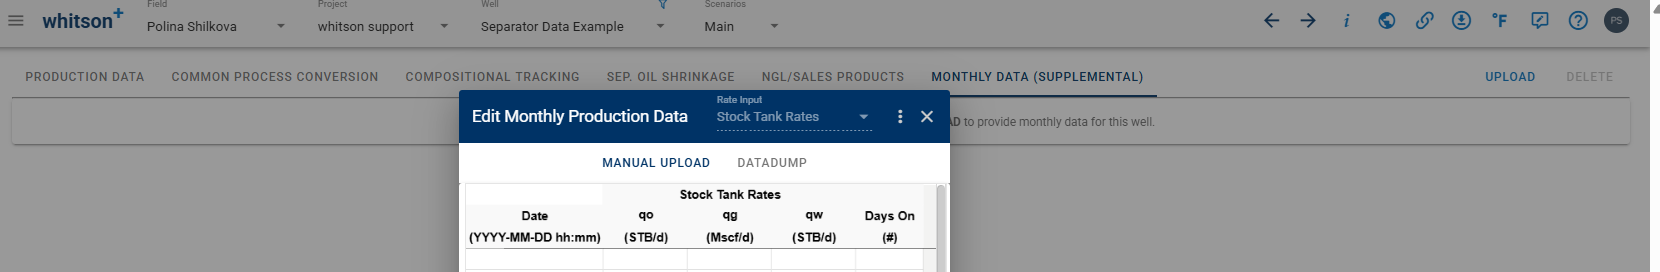
- Date: production data recording date
-
Stock Tank Rates
- qo: oil production rates at the stock tank (field: STB/d, SI/Metric: Sm\(^3\)/d, SI/Metric Canada: Sm\(^3\)/d)
- qg: gas production rates at the surface (field: Mscf/d, SI/Metric: 10\(^{-3}\)Sm\(^3\)/d, SI/Metric Canada: 10\(^{-3}\)Sm\(^3\)/d)
- qw: water production rates at the stock tank (field: STB/d, SI/Metric: Sm\(^3\)/d, SI/Metric Canada: Sm\(^3\)/d)
-
Days On: indicates the number of days the well was actively producing within the given timestep. Leaving it blank assumes the well produced for the entire timestep.
1. How to Add Supplemental Production Data and Co-Visualize
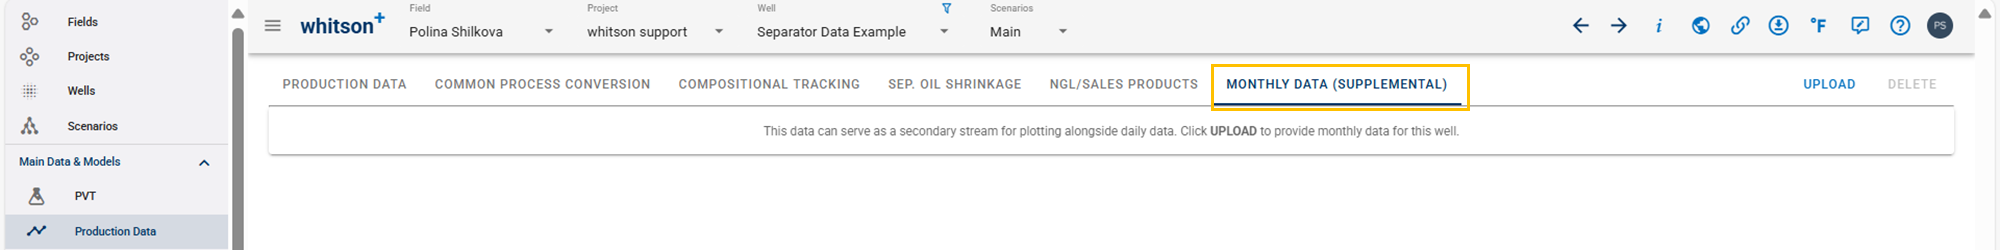
- In the Production Data module, click the MONTHLY DATA (SUPPLEMENTAL) tab at the top.
- Click the "UPLOAD" to upload data.
- Copy paste in the relevant columns.
- Click "SAVE" to the lower left when finished.
- Go to the Decline Curve Analysis module.
- Click the CO-VISUALIZE to the top right in the Rate-time decline plot.
- All the steps are shown in the gif above.
2. How to Upload
There are two ways to upload production data into whitson+:
- Manual upload. Copy and paste production data into frontend,
- Datadump pre-populated flat files (excel or csv)
2.1. Manual Upload
2.1.1 Upload data
- Click the "UPLOAD" to upload data.
- Copy paste in the relevant columns.
- Click "SAVE" to the lower left when finished.
- All the steps are shown in the gif above.
Remember
- The functionality is very similar to excel, so a good rule of thumb "if it works in excel, it works here".
- Just upload the data you have available, skip the rest.
2.1.2. Datadump pre-populated excel file
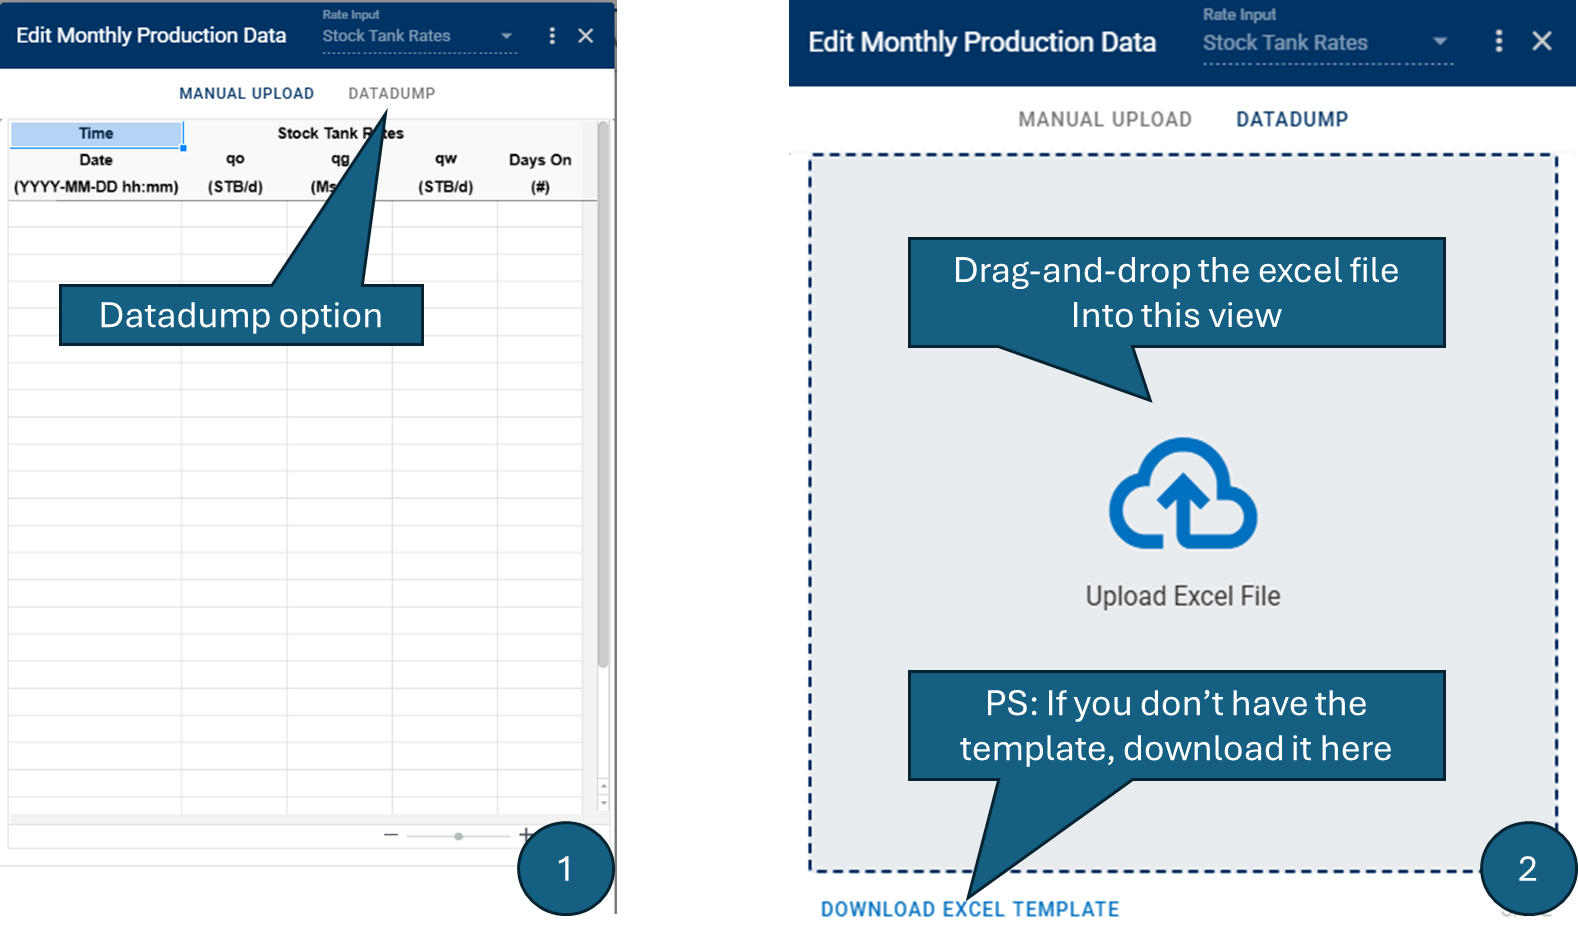
- Click the "arrow up" symbol to upload data.
- Click the datadump option at the top of the dialog box.
- Drag-and-drop the pre-populated datadump file into the frontend.
- If you don't have the template, you can access it by clicking "Download Excel Template".
- Click "Upload" to the lower left when finished.
- All the steps are shown in figures above.