Wsc
Wellstream Composition Estimation
Introduction
The following table summarizes the methods and their required input data. See Carlsen et al. for a comparative study of the different methods.
Every method requires an Equation of State (EOS) model and a seed feed composition, and the chosen method will largely depend on the data available to estimate the wellstream composition.
| Available Data | Method |
|---|---|
| GOR | Regression on Fg |
| GOR and API gravity | API Interpolation / Fg regression |
| GOR and Saturation Pressure | PSAT Interpolation / Fg regression |
| Comprehensive separator data GOR, MW, separator gas composition, and separator oil composition |
SPO Interpolation / recombination |
Seed Feed Compositions
A seed feed composition serves as an initial estimate of the actual wellstream composition. Any EOS model in whitson+ must contain a set of seed feed compositions applicable to the given field/basin. Seed feeds are required to estimate the actual wellstream composition with limited PVT data (see whitson+ wellstream estimation methods below). Seed feed compositions can either be actual sample compositions collected from a given field/basin or synthetically generated compositions honoring the trends of actual measured data such as stock tank oil API, GOR, \(\mathrm{C_{7+}}\) MW, etc.
The seed feed table associated with an EOS model in whitson+ can have a single composition or multiple compositions depending on the complexity of the fluid types in the given field/basin. For example, unconventional reservoirs have a wide range of GOR and API gravity that vary spatially. A single EOS model applicable to the entire basin must contain seed feeds that cover the entire range of expected stock tank oil APIs and GORs. This is to make sure that for any expected values of very limited (yet readily available) PVT data such as GOR and/or API, a reasonable estimate of the actual wellstream composition would be available. This estimate of the actual wellstream (called a seed feed) can then be fine-tuned to honor all measured input data, resulting in the actual wellstream composition.
The accuracy of the calculated wellstream composition depends heavily on the amount and type of the PVT data available for wellstream composition estimation. For this reason, whitson+ offers different wellstream estimation methods (see below) starting from the very basic single-input GOR method to the very complicated separator composition method. These methods give the user complete flexibility to use any/all measured data to get a wellstream composition as accurate as possible.
Methods
GOR Matching
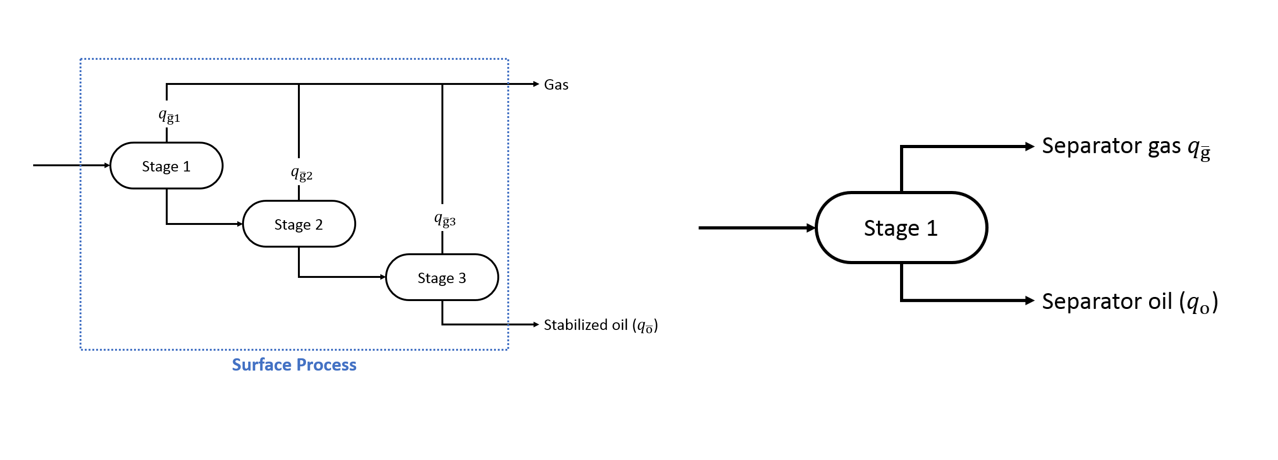
This is a simplified method using very limited data. It only requires a GOR and a surface process. The GOR can be a separator GOR or a full process GOR. See the note below for more details.
Understanding Process vs. Separator GOR
The GOR can be a separator GOR or a full process GOR.
Procedure:
- Flash all seed compositions \(z_{si}\) at the first-stage separator conditions \((p_1, T_1)\).
- Select the seed composition yielding the separator GOR closest to the input GOR.
- The obtained vapor and liquid compositions from flashing the selected seed composition are respectively named \(y_i\) and \(x_i\).
- Recombine the separator oil composition (\(x_i\)) and separator gas composition (\(y_i\)):
- Use \(z_i\) to calculate the GOR of the mixture \(z_i\).
- Calculate an RMS error (\(\delta_\mathrm{RMS}\)) quantifying the quality of the predictions:
The regression consists of minimizing \(\delta_\mathrm{RMS}\) by changing \(f_g\).
GOR-Constrained Regression
The regression always leads to a composition that matches exactly the measured GOR.
GOR and API Gravity Matching
This wellstream composition estimation method is a simplified method used when limited field data is available: GOR and stock tank oil API gravity. The input GOR can be a (total) process GOR or GOR from the first-stage separator, see this note for more details. Optionally, the user can also specify the amounts of non-hydrocarbons (when available) for an accurate description of these components in the calculated composition.
Procedure:
- Replace non-hydrocarbons in all seed compositions \(z_{si}\) if the user has specified these values.
- Flash all the seed compositions \(z_{si}\) from step 1 through the input process conditions. Calculate the corresponding API and GOR for each seed composition.
- Select the two seed compositions that bracket the input API.
- Interpolate between the two selected seed compositions to exactly match the input API.
- Flash the interpolated composition (step 4) at the first-stage separator conditions. The obtained separator gas and oil compositions are respectively named \(y_i\) and \(x_i\).
- Recombine the separator oil composition (\(x_i\)) and separator gas composition (\(y_i\)):
- Replace the non-hydrocarbons in the calculated \(z_i\) from step 6 with user-specified values.
- Use \(z_i\) from step 7 to calculate the first-stage separator GOR and (total) process GOR and stock tank liquid API gravity using the user-specified surface process. The \(z_i\) will match the input (process or separator) GOR and liquid API gravity exactly along with the non-hydrocarbons (if specified).
Input Data-Constrained Regression
This method always leads to a composition that matches exactly the input data: GOR, API gravity, and non-hydrocarbons (when available) except when the input API gravity is outside the range of APIs in the table of seed compositions.
GOR and PSAT Matching
This wellstream composition method is similar to the API-GOR method. The method is used when the GOR and saturation pressure are known for the wellstream composition either from PVT lab measurements or from production data analysis. The input GOR can be a (total) process GOR or GOR from the first-stage separator, see this note for more details. Optionally, the user can also specify the amounts of non-hydrocarbons (when available) for an accurate description of these components in the calculated composition.
Procedure:
- Replace non-hydrocarbons in all seed compositions \(z_{si}\) if the user has specified these values.
- Flash all the seed compositions \(z_{si}\) from step 1 through the first-stage separator of the input process conditions. Calculate the corresponding separator oil and separator gas compositions of all seed compositions.
- Recombine the calculated separator oil and separator gas for each seed composition from step 2 to match the input (separator or total) GOR, yielding new (modified) seed compositions honoring the input GOR.
- Filter the seed feed table by removing modified seed compositions calculated in step 3 that yield no (or unrealistic) saturation pressures at the input reservoir temperature.
- Select the two seed compositions that bracket the input saturation pressure.
- Interpolate between the two selected seed compositions using a variable F.
- Flash the interpolated composition (step 6) at the first-stage separator conditions. The obtained separator gas and oil compositions are respectively named \(y_i\) and \(x_i\).
- Recombine the separator oil composition (\(x_i\)) and separator gas composition (\(y_i\)): where Fg is the second variable.
- Replace the non-hydrocarbons in the calculated \(z_i\) from step 8 with user-specified values.
- Calculate saturation pressure and GOR for the calculated \(z_i\) using the input reservoir temperature and surface process.
- Regress on the two variables, i.e., F and Fg, to match the target PSAT and GOR.
- The \(z_i\) calculated after regression will match the input (process/total or separator) GOR and saturation pressure exactly along with the non-hydrocarbons (if specified).
Input Data-Constrained Regression
This method generally leads to a composition that matches exactly the input data: GOR, PSAT, and non-hydrocarbons (when available) except when the input saturation pressure is outside the range of saturation pressures in the table of seed compositions calculated in step 4. In very few cases, generally for a combination of very low saturation pressures (i.e. less than 2500 psia) and very high GORs (i.e. greater than 25000 scf/STB), the inputs may not be matched depending on the fluid systems used to develop the EOS model. In that case, the user should either review the inputs or contact our support team.
Comprehensive Separator Data Matching
This wellstream composition estimation method requires the following separator data:
- Separator \((p, T)\) conditions
- Separator GOR (see this note for more details)
- Separator oil (SPO) & gas (SPG) compositions (up to \(\mathrm{C_{7+}}\))
- \(\mathrm{C_{7+}}\) average MW of separator oil and gas
- (Optional) Stock tank liquid API gravity
When is stock tank liquid API important?
It is important to note that the stock tank liquid API referred to here is the API measured on the stock tank oil from the single-stage (atmospheric) flash of the collected separator oil in the PVT lab. The calculated composition without stock tank liquid API input should be accurate if the \(\mathrm{C_{7+}}\) of separator oil is reliable from the PVT lab. If the lab-reported separator oil \(\mathrm{C_{7+}}\) is not reliable, then we recommend that users specify the measured stock tank oil API. In that case, whitson+ will estimate the \(\mathrm{C_{7+}}\) molecular weight honoring the input API. The estimated \(\mathrm{C_{7+}}\) molecular weight is then used to extend the \(\mathrm{C_{7+}}\) composition to EOS \(\mathrm{C_{N+}}\) (e.g. \(\mathrm{C_{36+}}\)).
Why does whitson+ need separator oil \(\mathrm{C_{7+}}\) molecular weight when the user inputs stock tank liquid API?
Separator oil \(\mathrm{C_{7+}}\) molecular weight is used in whitson+ for two different purposes: (i) converting the lab-reported molar composition to lab measured mass composition and (ii) extending the \(\mathrm{C_{7+}}\) composition to EOS \(\mathrm{C_{N+}}\) (e.g. \(\mathrm{C_{36+}}\)). If the lab \(\mathrm{C_{7+}}\) is not reliable, this would mean that the lab-reported molar composition of separator oil up to \(\mathrm{C_{7+}}\) is wrong because the wrong (unreliable) \(\mathrm{C_{7+}}\) molecular weight was used to convert the reliable measured mass composition to the reported molar composition. Therefore, lab \(\mathrm{C_{7+}}\) molecular weight is always needed (and used) to convert the lab-reported molar composition back to measured mass composition up to \(\mathrm{C_{7+}}\). For (ii), the lab-reported \(\mathrm{C_{7+}}\) molecular weight is used if stock tank oil API is not input; otherwise, the estimated \(\mathrm{C_{7+}}\) molecular weight is used, honoring the input API.
Procedure without stock tank liquid API:
- Convert the input molar composition of SPO to mass composition (up to \(\mathrm{C_{7+}}\)).
- Flash all seed feeds at the given first-stage separator conditions to calculate SPOs.
- Normalize all SPOs to \(\mathrm{C_{7+}}\).
- Calculate a new set of SPOs by adding the \(\mathrm{C_{6-}}\) mass distribution of input SPO from (1) to the \(\mathrm{C_{7+}}\) mass distributions of all SPOs from (3).
- Calculate the \(\mathrm{C_{7+}}\) MW of all SPOs from (4).
- Select two SPOs from (5) that bracket the input SPO \(\mathrm{C_{7+}}\) MW.
- Interpolate the two selected SPOs to get a single SPO composition matching the input \(\mathrm{C_{7+}}\) MW exactly.
- Use an exponential molar distribution model with input SPG \(\mathrm{C_{7+}}\) MW to calculate the extended SPG molar composition (honoring the input \(\mathrm{C_{6-}}\) molar amounts and total \(\mathrm{C_{7+}}\) molar amount of SPG).
- Recombine the interpolated SPO from (7) and extended SPG from (8) to match the input GOR exactly at the given first-stage separator conditions.
Procedure with stock tank liquid API:
- Same as steps 1-4 from Procedure without stock tank liquid API presented above.
- Perform a single-stage flash of all SPOs to calculate STO API. (Standard conditions, i.e., 14.7 psia and \(60^\circ F\), are used to do the flash. Some labs may measure API by doing a single-stage flash at a temperature different from \(60^\circ F\).)
- Select two SPOs from (2) that bracket the input API.
- Interpolate the two selected SPOs to get a single SPO composition matching the input API exactly.
- Use an exponential molar distribution model with input SPG \(\mathrm{C_{7+}}\) MW to calculate the extended SPG molar composition (honoring the input \(\mathrm{C_{6-}}\) molar amounts and total \(\mathrm{C_{7+}}\) molar amount of SPG).
- Recombine the interpolated SPO from (4) and extended SPG from (5) to match the input GOR exactly at the given first-stage separator conditions.
Warning
The estimated wellstream composition when flashed to the input first-stage separator conditions will yield the input GOR exactly. There might be deviations in the calculated separator oil and separator gas compositions and SPO \(\mathrm{C_{7+}}\) MW (or stock tank liquid API) when compared to the input data, mainly depending on whether the separator samples were in equilibrium at the given separator conditions.
References
[1] Carlsen M., Dahouk, M., Mydland, S. and Whitson C., Compositional Tracking: Predicting Wellstream Compositions in Tight Unconventionals, IPTC-19596-MS, Society of Petroleum Engineers, 2020.