Bot
Introduction
All PVT tables provided by whitson+ are modified (i.e. including solution CGR \(r_s\) / \(R_v\)), extrapolated BO tables. These tables consist of three parts:
- The depletion of the initial in-situ reservoir fluid
- The extrapolation (eventually to a critical point)
- Average surface densities for oil and gas
Note
A black oil table is a two-component PVT model (oil and gas). Three properties are defined for each component - Composition (\(R_s\) | \(r_s\)) - surface process dependent - Formation Volume Factor (\(B_o\) | \(B_{gd}\)) - surface process dependent - Viscosity (\(\mu_o\) | \(\mu_g\)) - surface process independent The following are assumed to be constant in a black oil table: - Surface oil and gas densities - Surface process (#stages, Tsep, psep) - Reservoir temperature
Required Input
The required input data for generating a modified black oil table is:
- the composition of the initial in-situ reservoir fluid (\(z_{\mathrm{bo}i}\))
- the reservoir temperature (\(T_\mathrm{res}\))
- a surface process (\(\underline{P}\)) (multi-stage process)
- an Equation of State (EOS) model tuned to the relevant PVT data
Procedure
Depleted Part of the Table
This part of the table includes mixtures with a saturation pressure ranging from standard pressure to the original saturation pressure of \(z_{\mathrm{bo}i}\).
A Constant Composition Experiment (CCE) is simulated using \(z_{\mathrm{bo}i}\). At each stage of the CCE, the equilibrium phases are processed through the surface process \(\underline{P}\) and the modified black-oil properties (\(B_o\), \(R_s\), \(\mu_o\), \(B_g\), \(r_s\), \(\mu_g\)) are calculated.
Extrapolated Part of the Table
This part of the table includes mixtures with a saturation pressure greater than the original saturation pressure of \(z_{\mathrm{bo}i}\). Those mixtures are obtained by extrapolating the initial in-situ composition \(z_{\mathrm{bo}i}\).
Search a Critical Mixture
Definition
A mixture is considered critical if all its K-values (\(K_i = \frac{y_i}{x_i}\) where \(y_i\) and \(x_i\) are respectively the gas and oil molar fraction of component \(i\)) are equal to 1 at its saturation pressure and reservoir temperature.
The procedure to find a critical mixture is as follows:
- Flash the initial in-situ reservoir composition (\(z_{\mathrm{bo}i}\)) at its original saturation pressure. The obtained equilibrium phase compositions are called (\(x_{\mathrm{bo}i}\)) and (\(y_{\mathrm{bo}i}\)).
- Re-combine the equilibrium phases using a ratio \(F_V\):
-
Calculate the saturation pressure of the resulting composition \(z_{\mathrm{c}i}\) and its K-values \(K_i\).
-
Calculate a RMS error (\(\delta_\mathrm{RMS}\)) quantifying the deviation from 1 of the K-values: where \(\mathcal{C}\) is the set of components (e.g. \(\mathcal{C} = \left[ \mathrm{N_2}, \mathrm{CO_2}, \mathrm{C_1}, ... \mathrm{C_{36+}}\right]\))
Minimize \(\delta_\mathrm{RMS}\) by changing \(F_V\).
Two cases can occur:
-
The final mixture \(z_{\mathrm{c}i}\) verifies the critical criterion (for all \(i \in \mathcal{C}, K_i = 1\)). In that case, \(z_{\mathrm{c}i}\) is a critical mixture.
-
The final mixture \(z_{\mathrm{c}i}\) does not verify the critical criterion. This usually indicates that the saturation calculation blows up at some point, see this for more details.
Swell Test Check
Finding a critical mixture by extrapolating the original in-situ composition is not sufficient to ensure a consistent extrapolated BO table. We run a swell test on the initial in-situ composition to check if the critical point is admissible. The swell test uses the initial in-situ composition (\(z_{\mathrm{bo}i}\)) as starting point and injects its incipient phase.
Three cases can occur.
Definition: correct/wrong side of the swell test
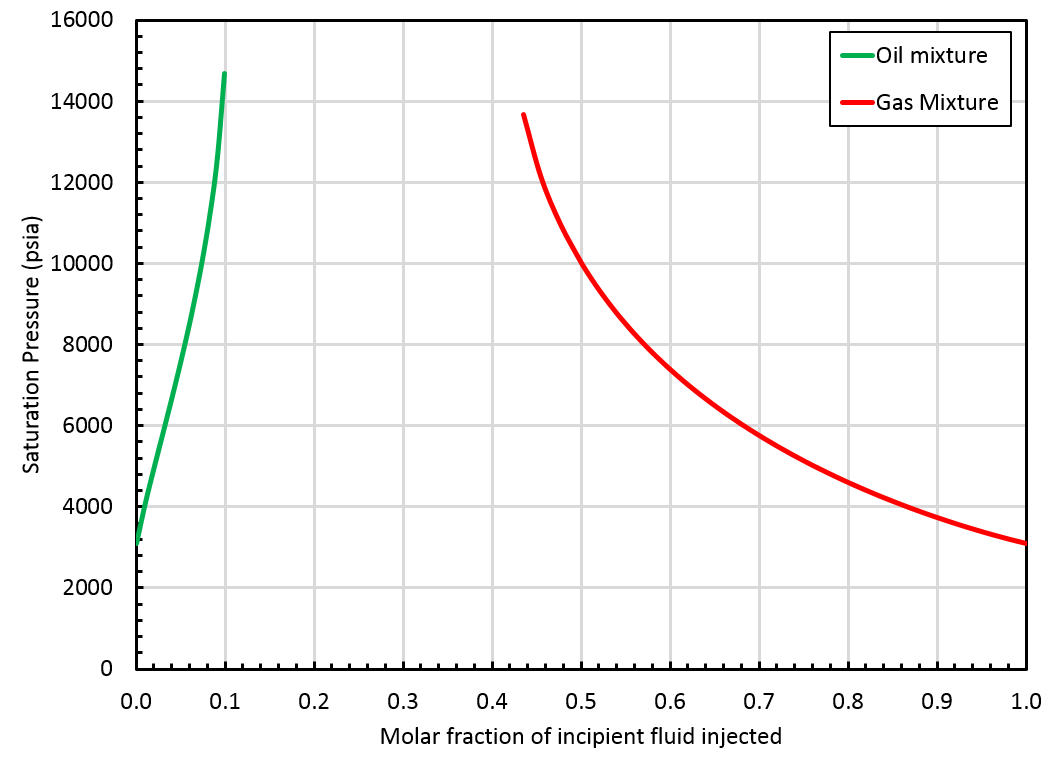
In the following section, we refer to the correct and wrong side of the swell test. Typically, in a swell test, the mixture saturation pressure increases until a maximum value (obtained for a fraction of incipient fluid injected called \(F_\mathrm{max}\)). The correct side of the swell test includes all fractions \(F\) verifying: The wrong side of the swell test includes fractions \(F\) verifying:
Case 1
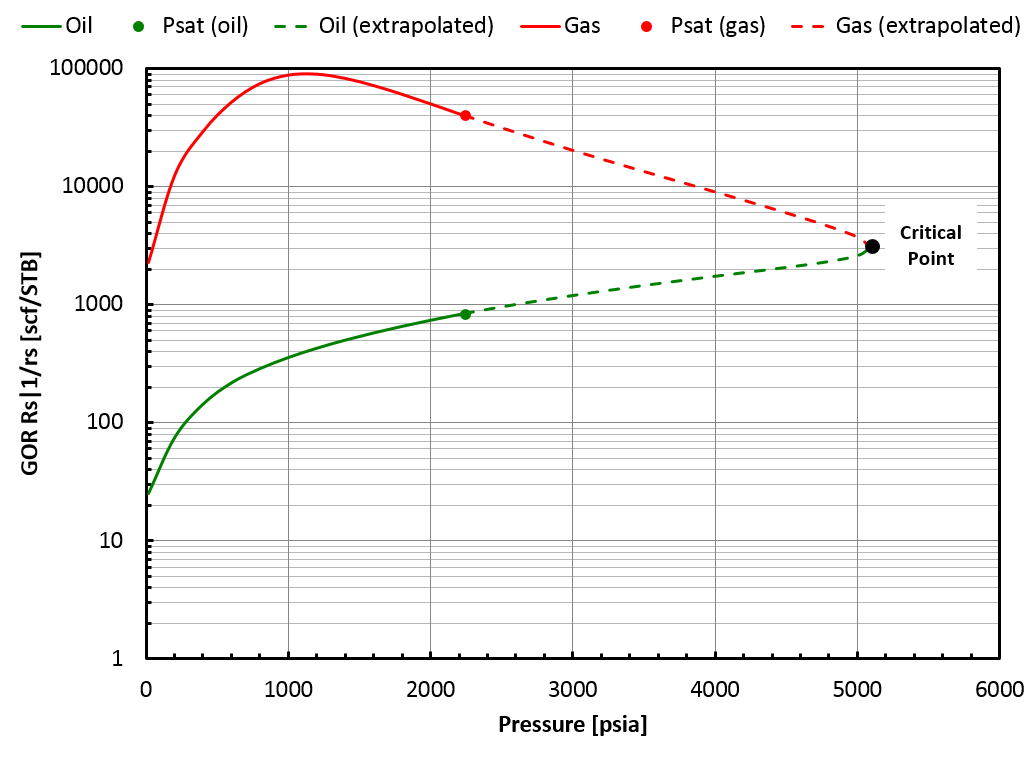
A critical mixture was found using the method presented above and it is located on the "correct" side of the swell test, see the figure below.
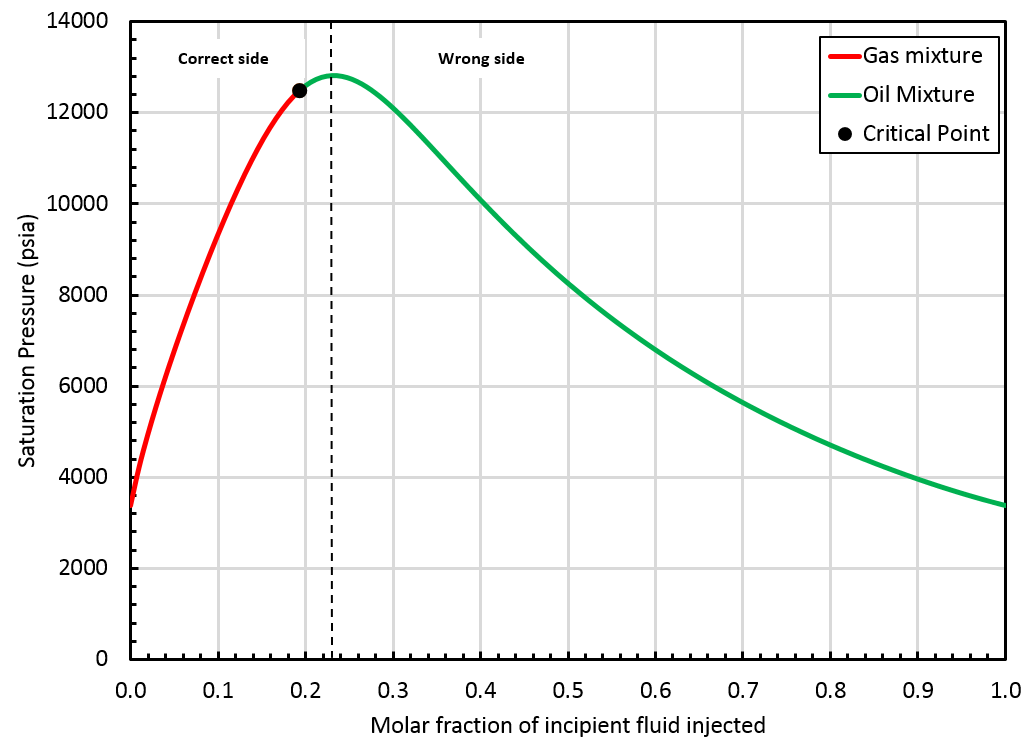
In that case, whitson+ can provide an extrapolated BO table up to the critical mixture (\(z_{\mathrm{c}i}\)). Such a BO table offers a smooth transition from oil to gas mixtures, see picture below.
Case 2
A critical mixture was found using the method but it is located on the "wrong" side of the swell test, see the figure below.
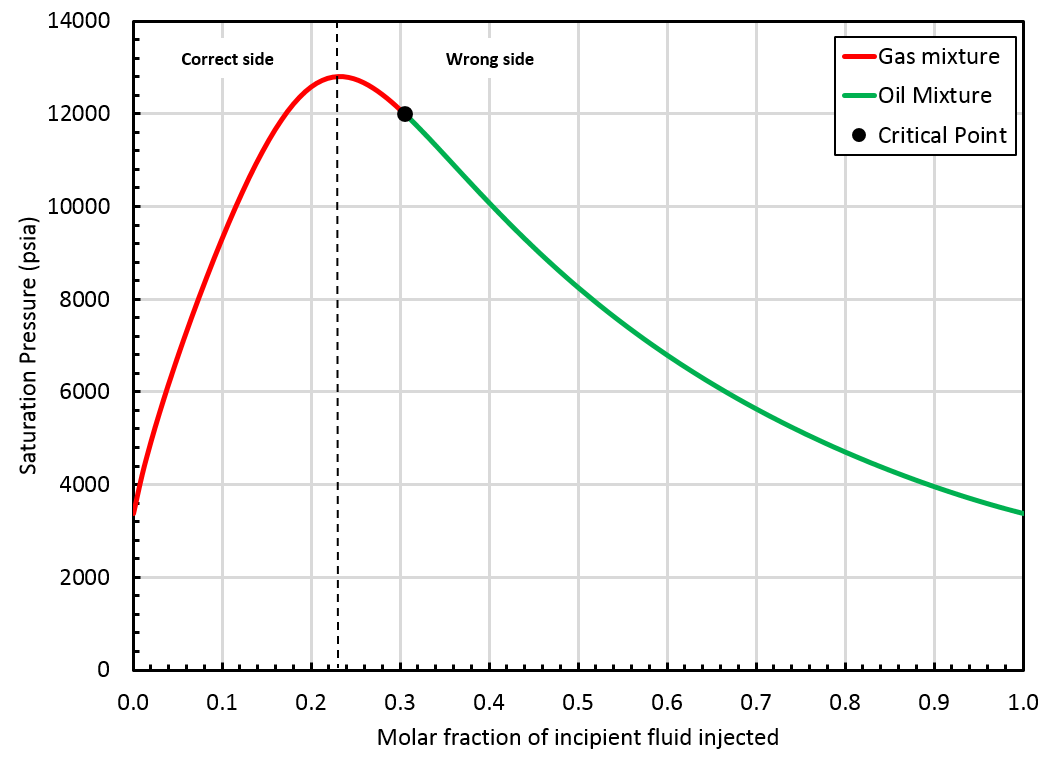
In that case, the BO table will be extrapolated up to the saturation pressure of the found critical mixture (\(z_{\mathrm{c}i}\)), but by staying on the correct side of the swell test. This is not a critical mixture, so there is a gap between oil and gas properties at the highest pressure in the table, see picture below.
Case 3
The critical mixture search method failed to find a critical mixture and the swell test blows up at some point, see the figure below.
Note
Laboratory examples of swell tests that "blow up" / "do not close" are given in Chapter 8 of the SPE Phase Behavior Monograph by Whitson & Brule 1
In that case, whitson+ will provide a BO table extrapolated up to the highest finite saturation pressure found on the correct side of the swell test. This saturation pressure is obtained for a mixture that we call \(z_{\mathrm{c}i}\). Note that \(z_{\mathrm{c}i}\) is not a critical mixture and therefore, there is a gap between oil and gas properties at that pressure, see this figure.
Depletion Experiment for the Extrapolated Part of the Table
A CCE (Constant Composition Expansion) experiment of \(z_{\mathrm{c}i}\) is simulated from its saturation pressure until the saturation pressure of the initial in-situ reservoir mixture (\(z_{\mathrm{bo}i}\)). At each stage of the CCE, the equilibrium phases are processed through the surface process \(\underline{P}\) and the modified black-oil properties (\(B_o\), \(R_s\), \(\mu_o\), \(B_g\), \(r_s\), \(\mu_g\)) are calculated.
Surface Densities
In the black-oil model, surface oil and gas densities (\(\rho_\mathrm{\bar{o}}\) and \(\rho_\mathrm{\bar{g}}\)) are assumed to be constant.
Oil and gas densities at reservoir conditions (\(p\) and \(T_\mathrm{res}\)) can be calculated from: and
where \(c_1\), \(c_2\), \(c_3\) and \(c_4\) are coefficients depending on the unit systems used.
whitson+ finds the optimal surface oil and gas densities (\(\rho_\mathrm{\bar{o}}\) and \(\rho_\mathrm{\bar{g}}\)) that minimize:
where:
-
\(\mathcal{P}\) is the set of pressure used in the depletion experiment (e.g. \(\mathcal{P} = \{5000, 4800, 4600, ..., 14.7 \}\)
-
\(\rho_\mathrm{o}^\mathrm{eos}(p)\) is the EOS-predicted oil density at (\(p\), \(T_\mathrm{res}\))
-
\(\rho_\mathrm{o}^\mathrm{calc}(p)\) is the calculated oil density at (\(p\), \(T_\mathrm{res}\)) using Eq. (\ref{eq:oil-den})
-
\(\rho_\mathrm{g}^\mathrm{eos}(p)\) is the EOS-predicted gas density at (\(p\), \(T_\mathrm{res}\))
-
\(\rho_\mathrm{g}^\mathrm{calc}(p)\) is the calculated gas density at (\(p\), \(T_\mathrm{res}\)) using Eq. (\ref{eq:gas-den})
-
\(W_\mathrm{o}\) and \(W_\mathrm{g}\) are weight factors depending on the reservoir type.
| Reservoir Type | Value of \(W_\mathrm{o}\) | Value of \(W_\mathrm{g}\) |
|---|---|---|
| Under-saturated oil reservoir | 10 | 1 |
| Under-saturated gas reservoir | 1 | 10 |
| Saturated reservoir | 1 | 1 |
Non-Monotonic Behaviors
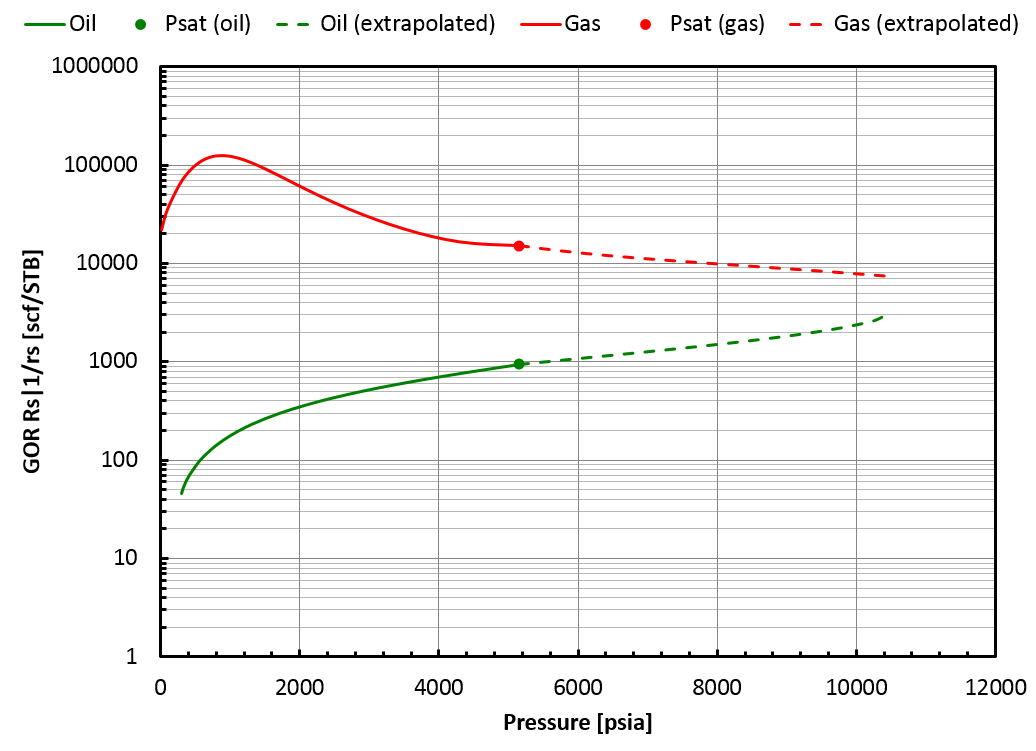
A non-monotonic behavior of \(R_\mathrm{s}\) may occur for lean reservoir fluids (e.g. gas condensates), as seen in the figure below. This is physically explained by the fact that the first droplets of condensate that drop out from the reservoir gas are very heavy and get lighter when pressure decrease, thus increasing \(R_\mathrm{s}\).
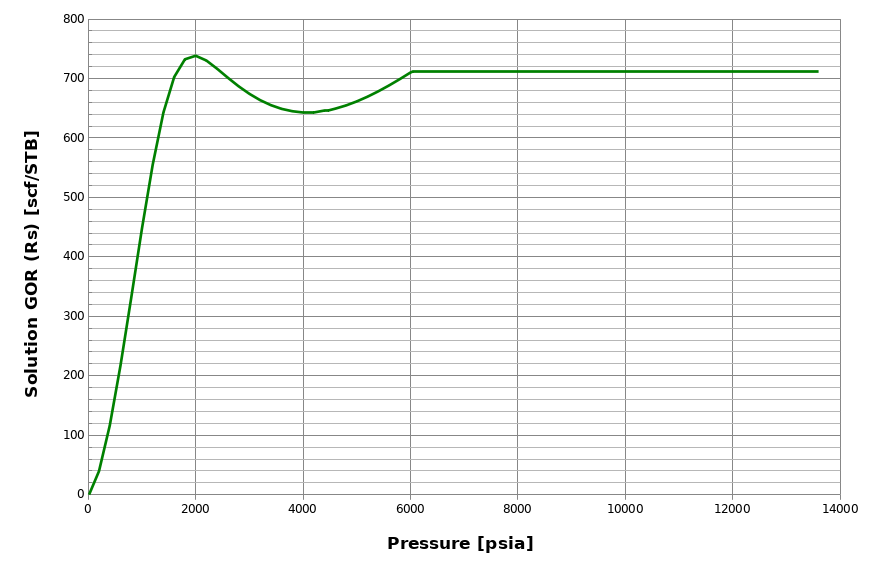
However, even though this behavior is physically correct, many reservoir simulators do not accept non-monotonic \(R_\mathrm{s}\) input in the BO tables. whitson+ checks for non-monotonic behaviors when generating BO tables. If such behavior is found, then whitson+ applies a modified procedure for both the depleted part of the table and the extrapolated part.
Depleted Part of the Table (non-monotonic Rs)
whitson+ will run two separate CCE simulations (one for oil, one for gas) with different compositions:
-
The BO properties of the gas phase are still obtained by simulating a CCE of \(z_{\mathrm{bo}i}\).
-
The BO properties of the oil phase are obtained by simulating a CCE of the incipient oil phase of \(z_{\mathrm{bo}i}\) (this mixture was previously called \(x_{\mathrm{bo}i}\)).
Extrapolated Part of the Table (non-monotonic Rs)
Since the depleted part of the BO table uses two fluids, (\(z_{\mathrm{bo}i}\) for the gas phase and \(x_{\mathrm{bo}i}\) for the oil phase, whitson+ will perform two separate extrapolations to avoid non-smooth behavior at the junction of the two parts of the BO table:
-
The procedure described here is applied to the gas phase.
-
For the oil phase, the extrapolation is performed by staying on the "wrong" side of the swell test. This ensures a smooth transition of the oil BO properties.
Warning
Non-monotonic behavior always leads to BO tables that are not entirely closed (meaning that there is a gap between oil and gas properties at the highest pressure), see this figure.
References
[4] Whitson, C. H., & Brulé,M. R., SPE Phase Behavior Monograph, 2000.
-
Curtis H Whitson, Michael R Brulé, and others. Phase behavior. Volume 20. Henry L. Doherty Memorial Fund of AIME, Society of Petroleum Engineers …, 2000. ↩