ROBIN Gas Well
1. Well Setup
1.1. Background
- Review the pressure gradient. If it is lower, there is no need for a geomechanical workflow.
1.2. PVT
- Change the PVT setting from GOR to Dry/Wet Gas.
1.3. Bottomhole Pressure
- Calculate bottomhole pressure.
- Select Woldesemayat & Ghajar.
1.4. Liquid Loading Plot
- Open the Liquid Loading plot and confirm the well is not liquid loaded.
2. Interpretation
2.1. Flowing Material Balance
- Use Flowing Material Balance to estimate OGIP.
- Result: OGIP = 12,000 MMscf.
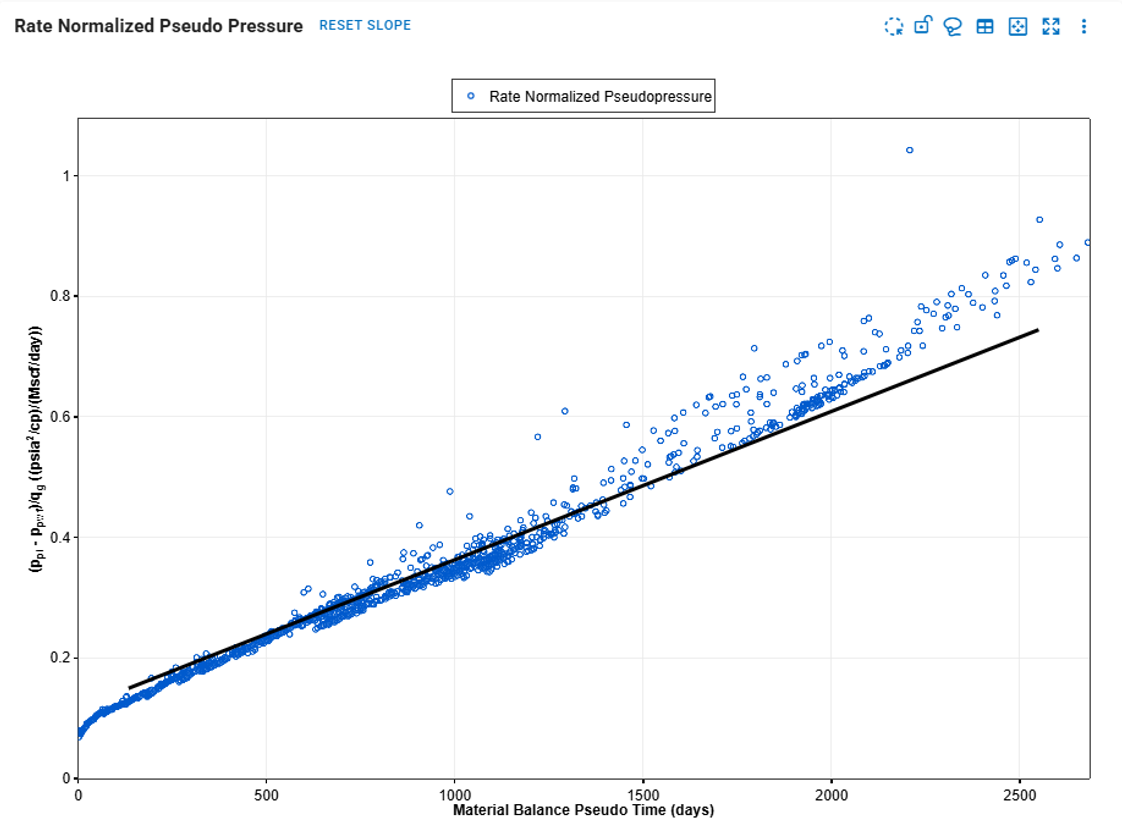
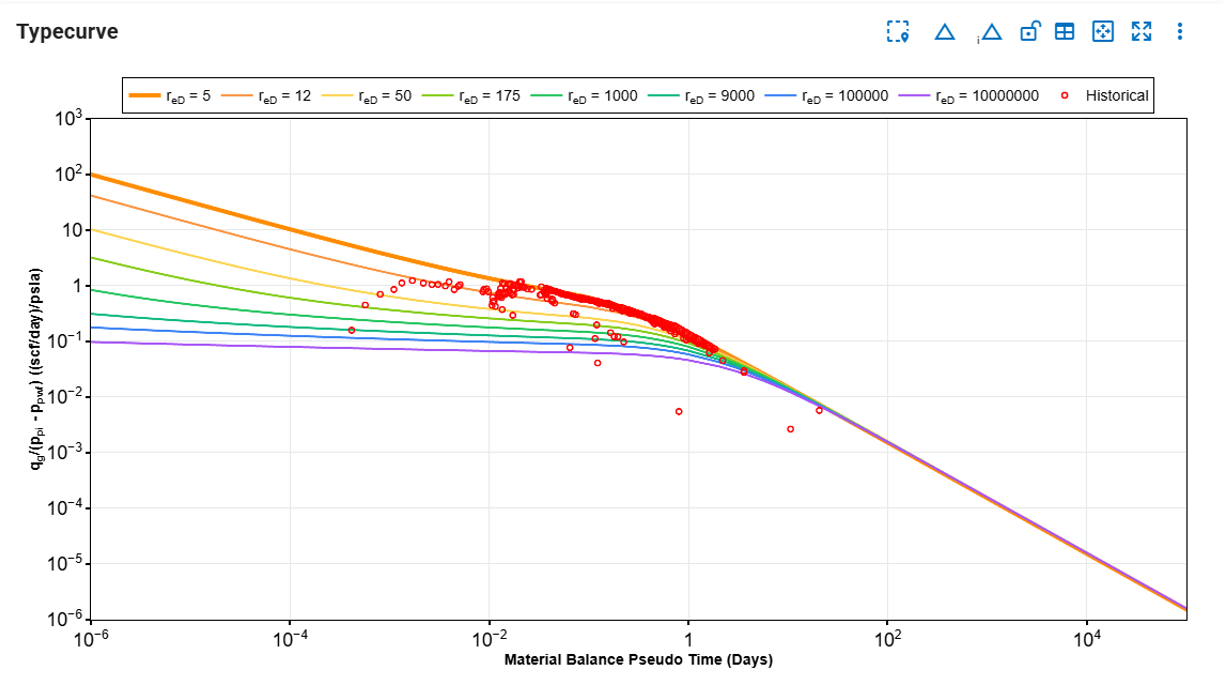
3. Analytical RTA
3.1. Typecurve
- Interpretation: linear flow with some bounded flow, with early data issues.
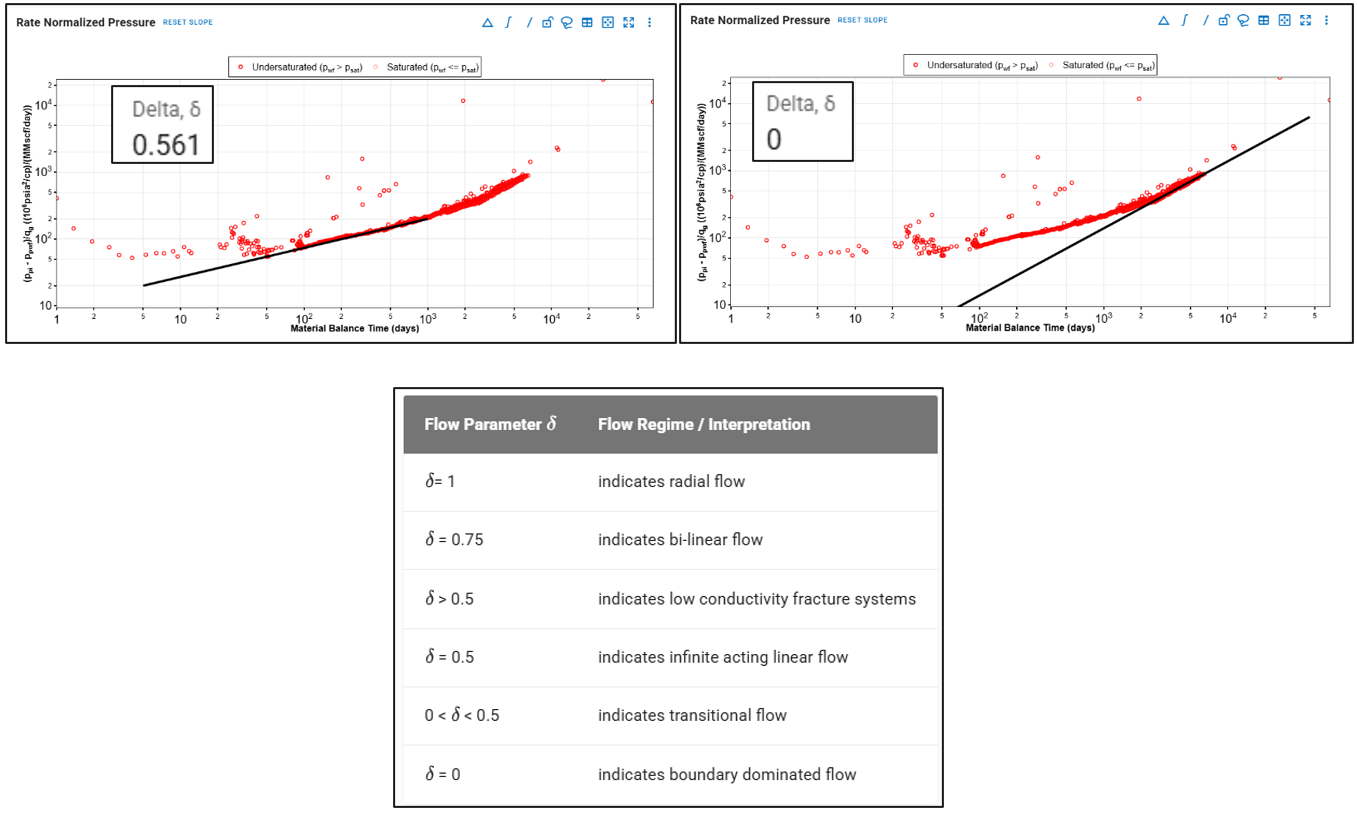
3.2. Fractional
- Interpretation: linear flow, with skin and bounded flow detected.
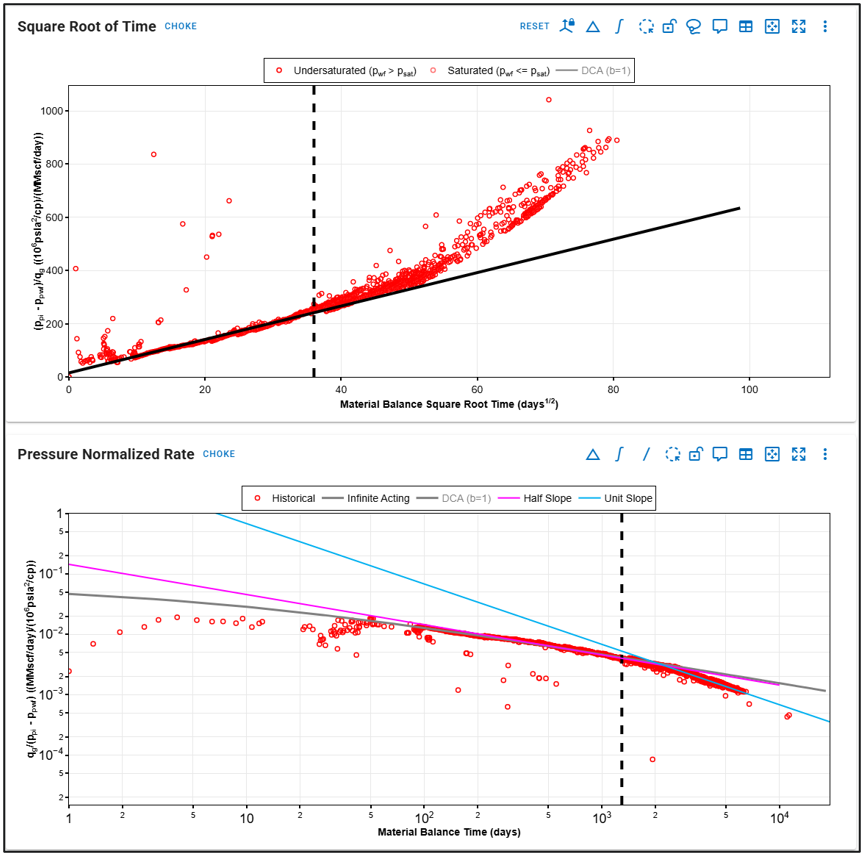
3.3. Classical
- Interpretation: linear, bounded, and skin are present.
4. Numerical RTA
4.1. First Run
- Use 10 larger models.
- Lock OGIP = 12,000 MMscf (from Flowing Material Balance).
- Run.
4.2. Second Run
- Drop Sw to 32%.
- Run.
- Results:
- OGIP = 12 Bcf
- LFP = 157k
5. Single Well Modeling
5.1. Numerical Model
- Time Stepping = Smart.
- Well Control = BHP.
- Run.
5.2. Forecast
- Forecast End Day = 18,000.
- Use Constant BHP.
- Run.
- Result: EUR = 11.4 Bcf.