whitson+ - BHP Certification
1. Introduction
Complete the steps outlined below to become a certified whitson+ user. It includes performing BHP calculations for wells with artificial lift methods (Gas Lift, Rod Pump, and ESP). Those certified have the software skills necessary to complete most well BHP evaluation projects in tight unconventionals.
Need help?
Send an e-mail to support@whitson.com.
1.1. Before Starting
Make sure you have watched these three videos in the Getting Started part of the manual (click here).
- Login (1 min)
- Overview of important basics (3 min 30 sec)
- Zoom lots (3 min)
1.2. Create a Project
- Go to the Project module in the navigation panel.
- Click ADD PROJECT up to the right.
- Name the project "your name - whitson certificate".
- Click SAVE.
- All steps are shown in the .gif above.
1.3 Upload Well Data
- Click MASS UPLOAD up to the right.
- In the pop-up window, select EXAMPLES
- Search for BHP Certificate Wells and click UPLOAD
- All the data will be uploaded into the project. You can then close the Mass Upload pop-up window.
- All steps are shown in the .gif above.
2. Gas Lift Well
In this section, we will add a gas lift configuration and calculate BHP for three different gas lift types: poor-boy, user-input multi-valve designs, and automatic. This well is produced through the tubing with gas injection via the annulus. Lastly, we will calculate BHP from the static (quiet) side instead of the default, flowing side, using injection pressures and gas gravity instead of the wellhead pressure on the flowing side.
2.1. Production Data
Before calculating the BHP, you need to check if the production data is appropriately uploaded for this well. Also, since this well will be a gas lift well, you need to check if it has a gas lift rate that already exists in the data.
- Go to Wells in the navigation panel and select Gas Lift Well.
- Go to the Production Data module in the navigation panel.
- Click the sorting calendar icon under the production plot to see the last production record. This well has been producing for 4 months.
- To isolate the Gas Lift profile only on the plot, you can double-click the Gas Lift on the legend. The gas lift rate profile should be like on the GIF above.
- To bring back all the profiles on the plot, double-click on it again.
- All steps are shown in the .gif above.
You can also edit or smooth the production data, but you don't need to do anything with it here.
2.2. Poor-Boy Configuration
The term "Poor-Boy" refers to the situation when injection occurs at the end of tubing (EOT). For this case, BHP will be calculated from the surface (using wellhead pressure measurements in the flowpath) to the Top of Perforation (TOP) through the flowing side, assuming full multiphase flow and a gradient change at the injection depth.
- Go to the Bottomhole Pressure module in the navigation panel.
- Open the Well Data input card by clicking the edit icon.
-
Change the Perforated Interval and Deviation Survey input according to the figure below.
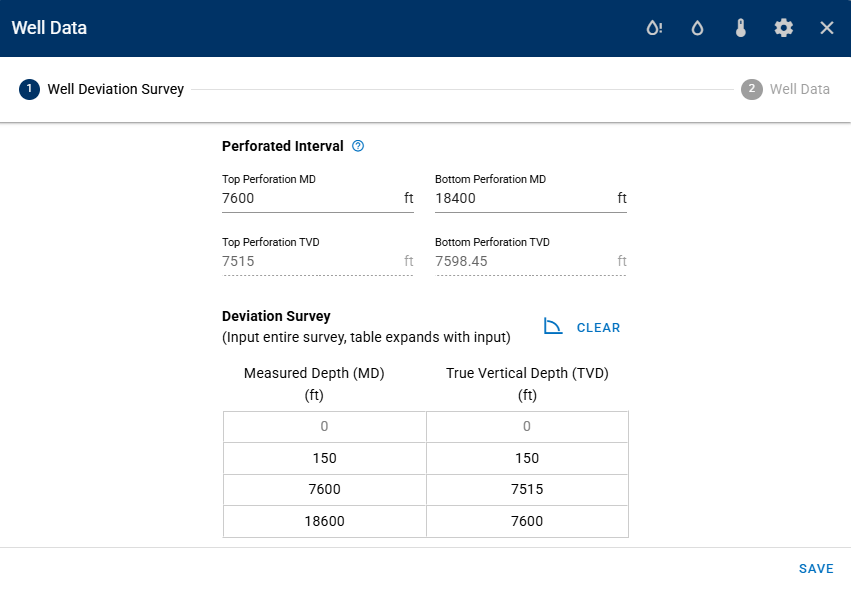
-
Click Well Data tab on the top-right.
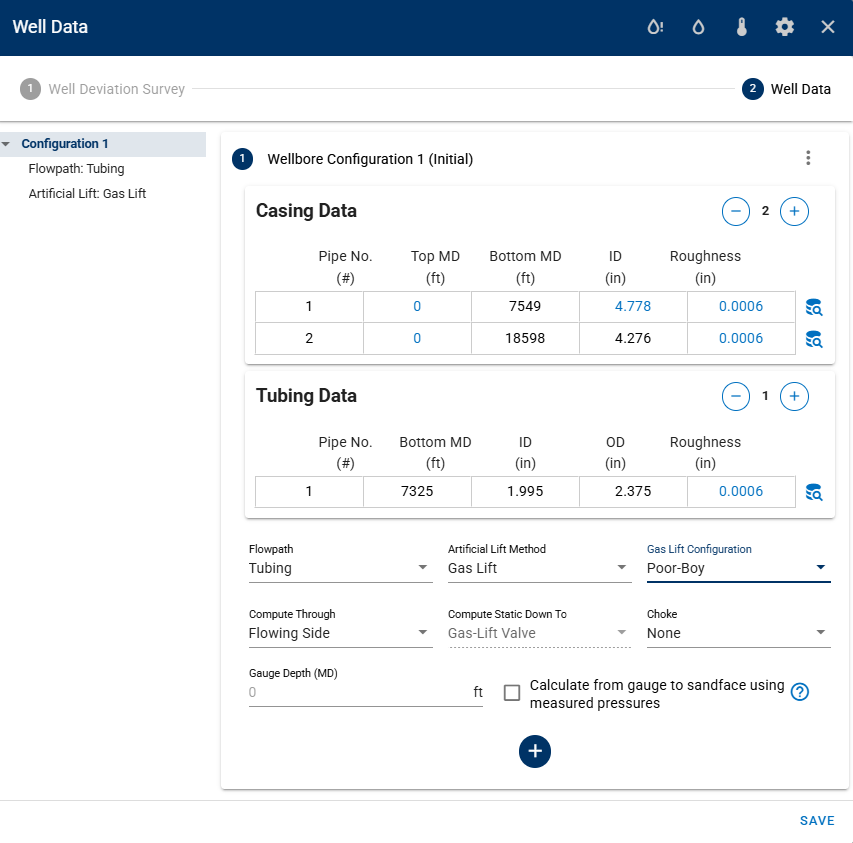
- Input the Casing Data and Tubing Data on the Well Data as shown in figure below.
- Select "Tubing" as the Flowpath with Poor-Boy as the Gas-Lift Configuration.
-
Select Flowing Side computation, i.e. we calculate the BHP by traversing down the tubing using tubing head pressures.
-
Click SAVE.
- Proceed to CALCULATE BOTTOMHOLE PRESSURE.
- Select Beggs & Brill as the bottomhole pressure to be used in calculations.
- All steps are shown in the .gif above.
The "Bottomhole pressure to be used in calculation" drop-down menu (at the top) determines which BHP correlation will be applied throughout the software for calculations.
2.3. Valves Configuration
Similar to previous section, but instead of injecting at the EOT, you can input all the valve details, including installation depths (in MD) and surface opening/closing pressures, based on the actual gas lift design. BHP will be calculated from the tubing side, following the flowing side computation again.

- Open the Well Data input card by clicking the edit icon.
- Go to the Well Data tab on the top-right to see all your wellbore configurations.
- Change the Gas-Lift Configuration into Valves.
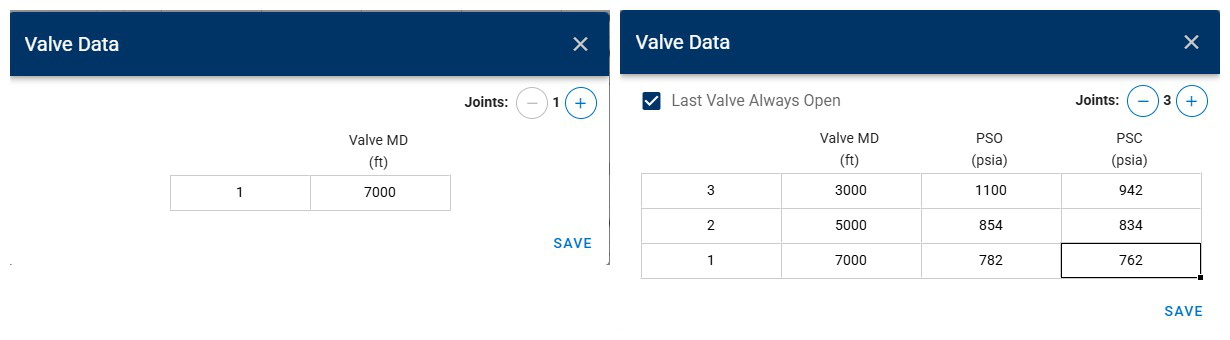
- Exercise 1: Input the Valve Data on the table for a single depth using the data in the figure below.
- Click SAVE.
- Ensure that the botthomhole pressure to be used is Breggs & Brill.
- Proceed to CALCULATE BOTTOMHOLE PRESSURE.
- All steps are shown in the .gif above.
- Exercise 2: Now, try to input multiple valve depths using the data in the figure below.
To determine which valve is actively injecting, navigate to the GAS LIFT PLOT tab in the Bottomhole Pressure module. Injecting lift gas deeper in the wellbore typically results in a lower BHP, improving well drawdown and production efficiency.
Note
If a complete set of valves is provided, the casing head pressure (CHP) determines which valve injects the lift gas into the tubing. If "Last Valve Always Open" is selected, the calculator will ignore PSO and PSC for valve 1 (if specified).
2.4. Automatic Configuration
The automatic configuration calculates the pressure gradient in the tubing and annulus, identifying the depth where these two profiles intersect - this becomes the injection depth at that time. This method is especially useful when a gas lift design is unavailable. This is repeated for all the timesteps to calculate the injection depth and hence, the BHP.
- Open the Well Data input card by clicking the edit icon.
- Go to the Well Data tab on the top-right to see all your wellbore configurations.
- Change the Gas-Lift Configuration into Automatic.
- Click SAVE.
- Ensure that the botthomhole pressure to be used is Breggs & Brill.
- Proceed to CALCULATE BOTTOMHOLE PRESSURE.
- All steps are shown in the .gif above. Can you spot any differences in the BHP results between the user-input and automatic valve depths? Which configuration results in a lower BHP?
Hint: GAS LIFT PLOT
2.5. Static (Quiet) Side BHP Computation
The static (quiet) side uses the "not flowing side" to compute BHP. For example, if fluid is produced through the tubing, the static side is the annulus. This method is particularly useful when the flowing side data (in this example is tubing pressure) is missing or unavailable for an extended period. The static-side calculation is well suited for gas-lift assisted wells where it is certain that the static side is filled with gas at least down to the gas-lift valve.
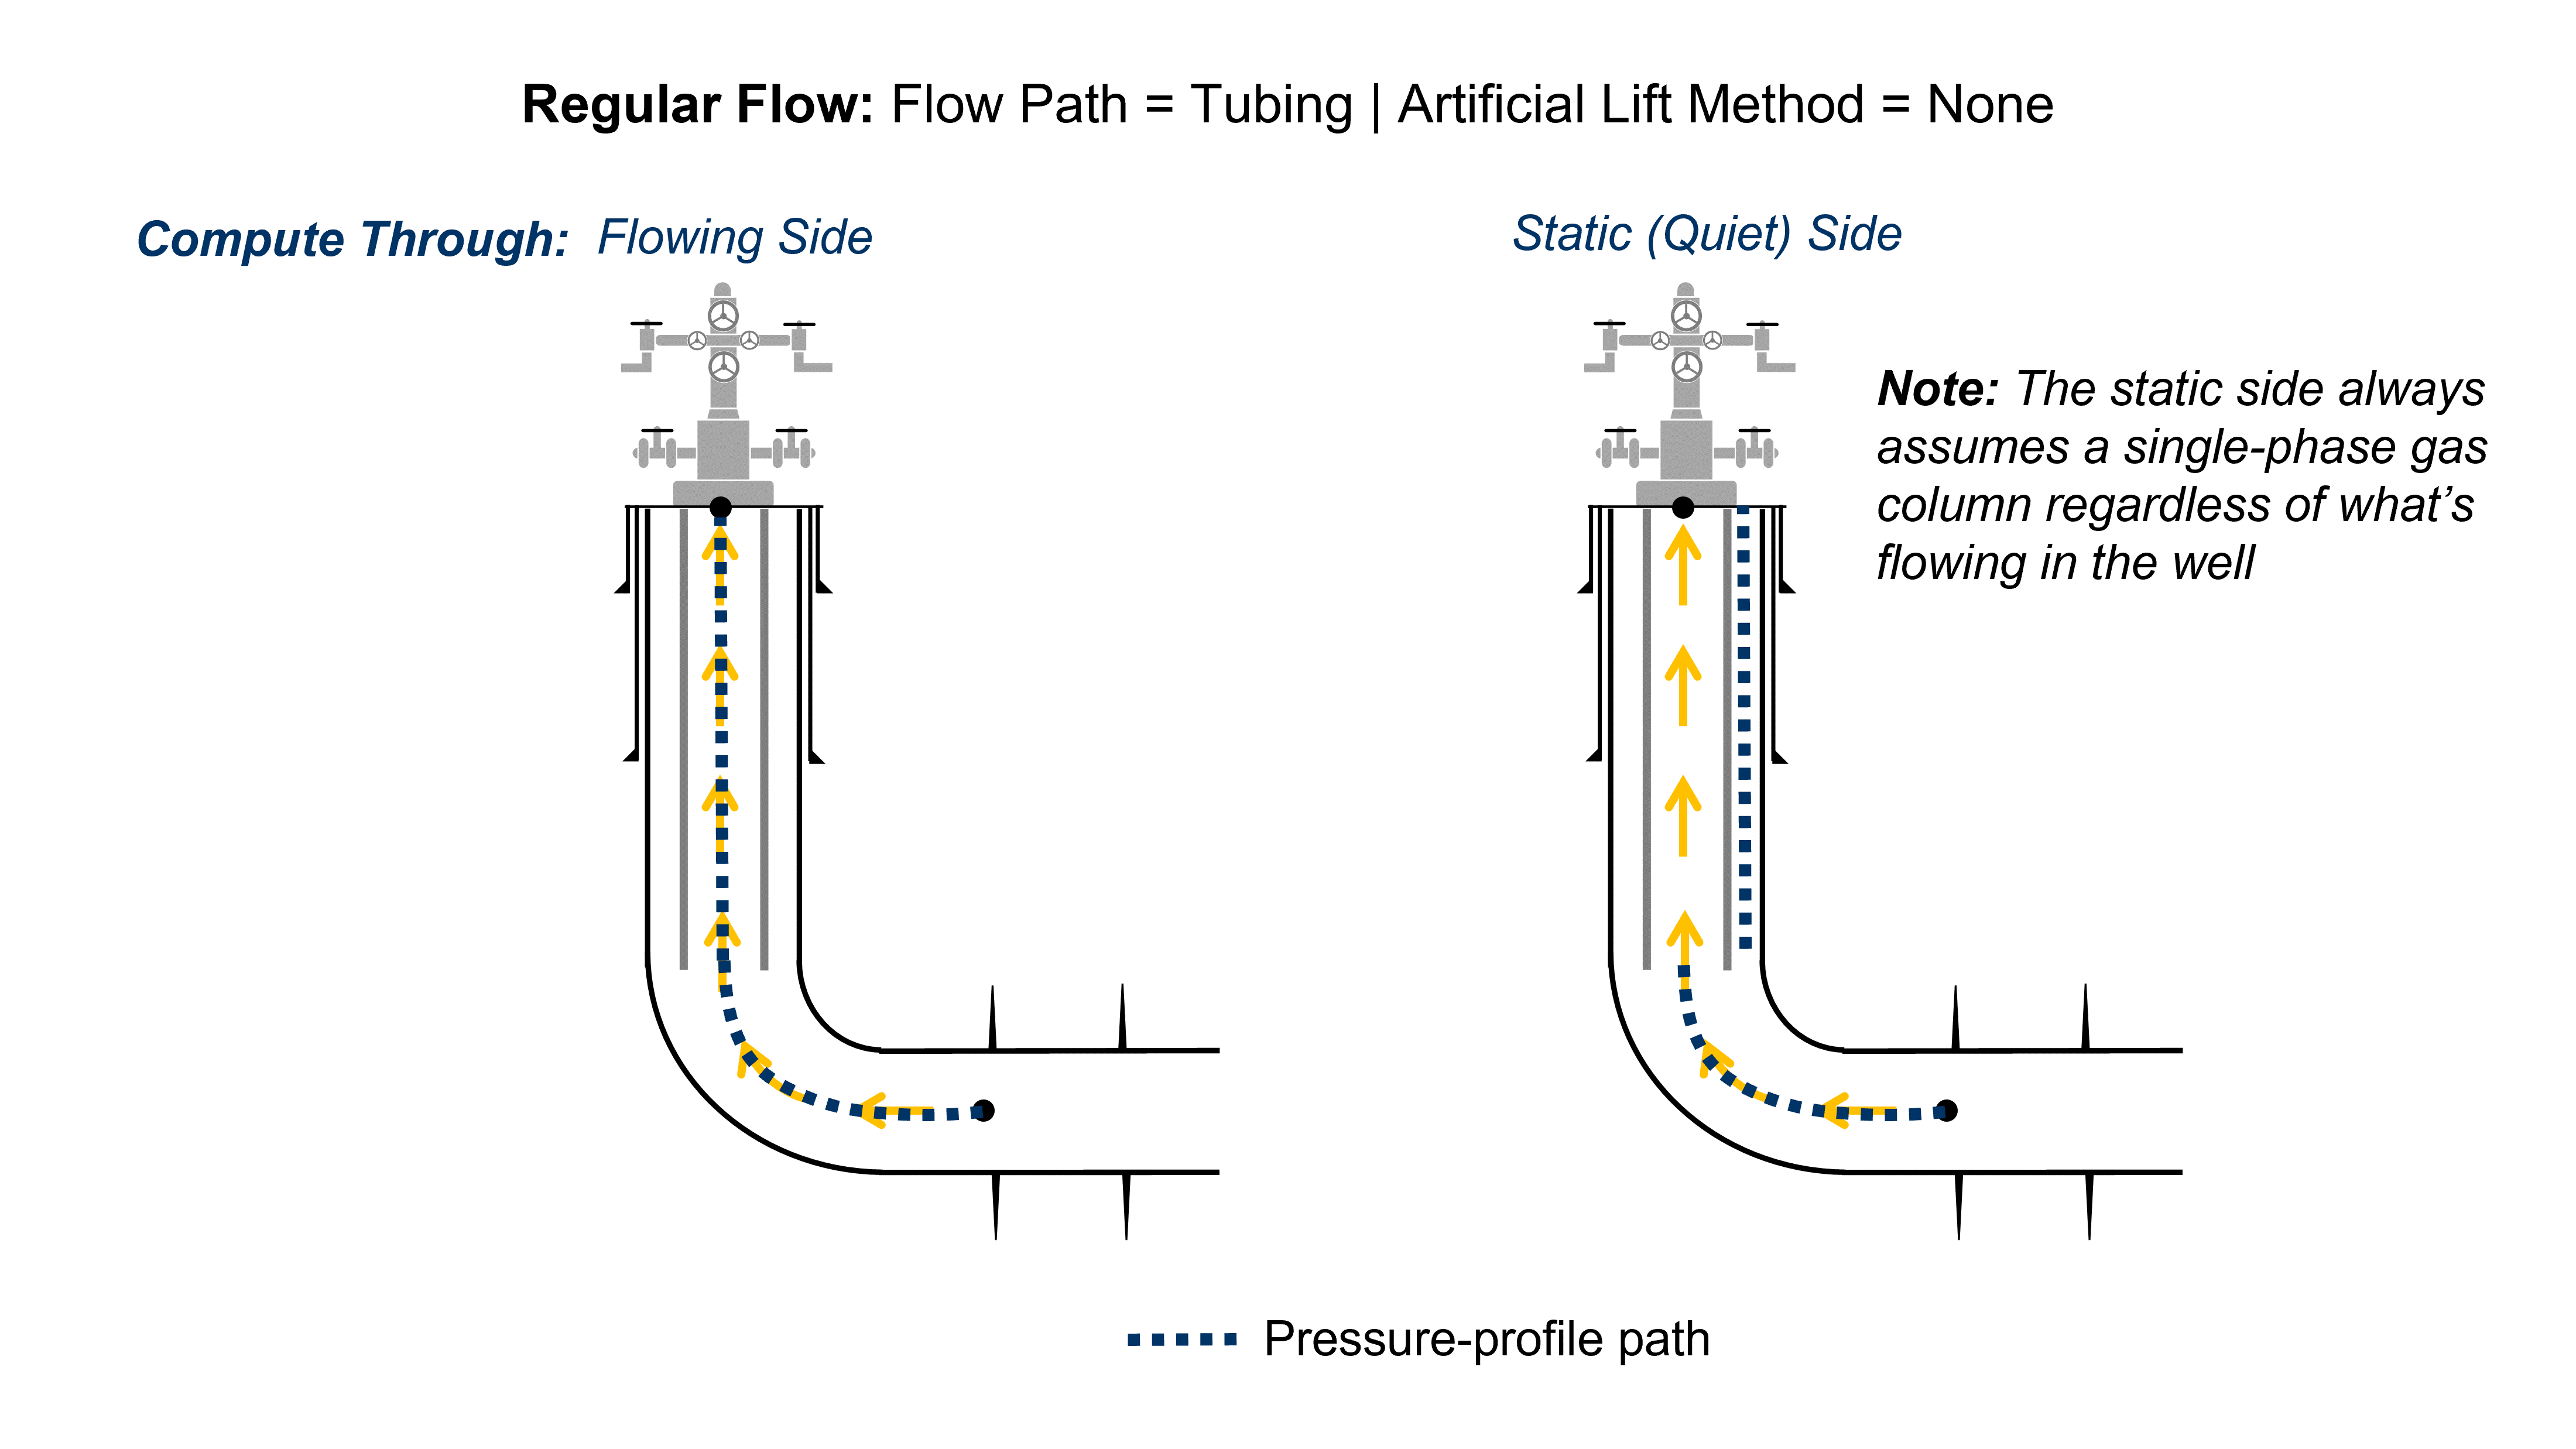
Now, let's switch the computation to the Static (Quiet) Side and analyze the BHP results using the non-flowing side, i.e. the annulus when production occurs through the tubing.
- Open the Well Data input card by clicking the edit icon.
- Go to the Well Data tab on the top-right to see all your wellbore configurations.
- Select the Static (Quiet) Side as the Compute Through method.
- Change the Compute Static Down To option into the Gas-Lift Valve.
- Click SAVE.
- Proceed to CALCULATE BOTTOMHOLE PRESSURE.
- All steps are shown in the .gif above.
Do you notice that the BHP results do not make sense at early time? This happens because we have no gas injection rates in the production data table and since the well was produced via the tubing, without gas injection (hint - very low casing pressure), only the tubing head pressures seem reasonable to calculate BHP (try switching it to flowing side to correct it).
By default, the BHP is calculated even when you do not have gas lift rates, but uses the surface pressures based on your selection in Compute Through (flowing or static side) . In situations where you have gas lift but no rates and only injection pressures, your BHP will still be calculated correctly.
3. Rod Pump Well
Now, we will calculate BHP for a well using a rod pump as the artificial lift method. After that, we will smooth the BHP calculation results and examine the BHP calculation settings.
3.1. Rod Pump Configuration
BHP calculations with a rod pump are achieved by dividing the well into three parts, as shown in figure below.
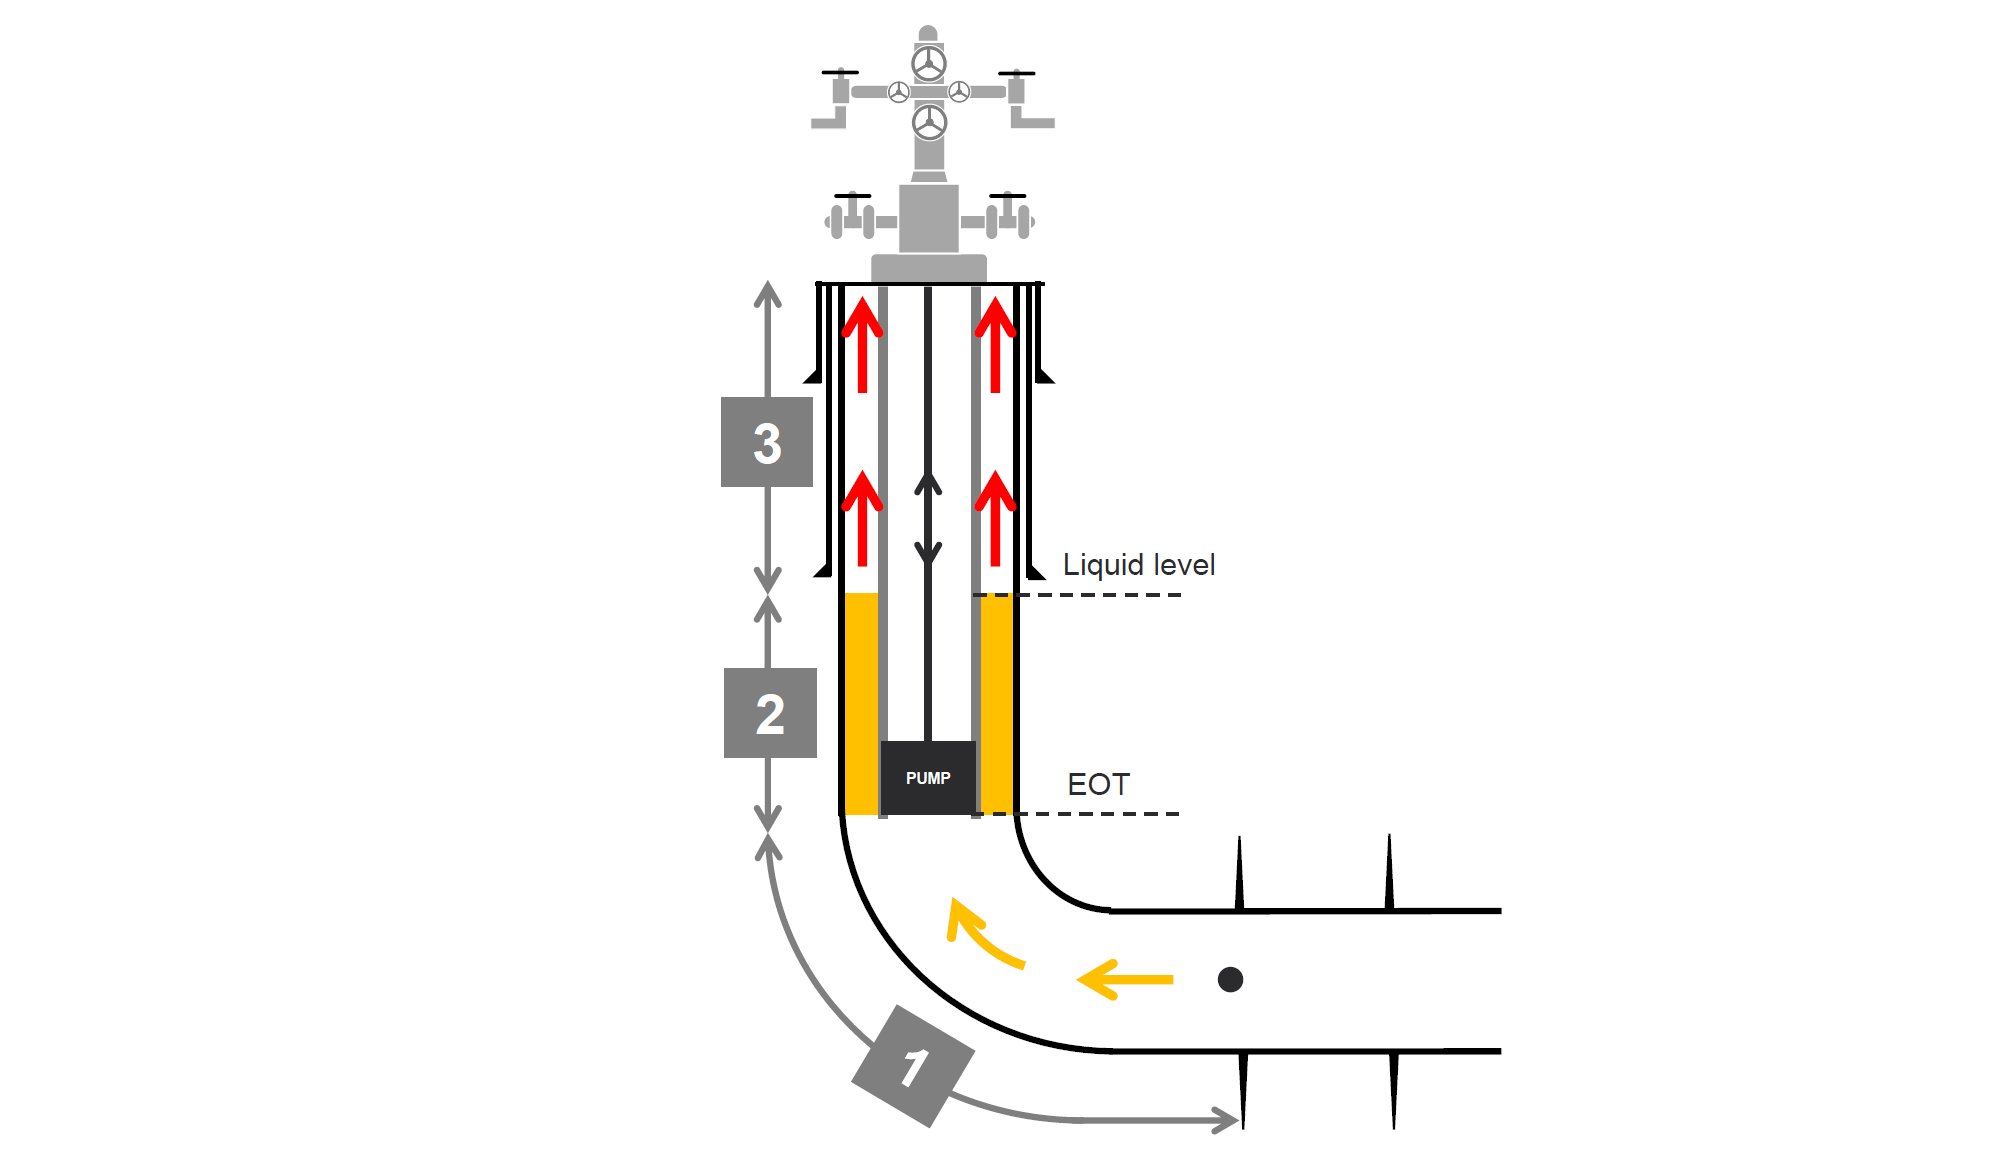
A crucial input for accurately calculating BHP with a rod pump is having liquid level data for the well. Since casing pressure is always used as the pressure source for rod pumps (while tubing pressure is ignored), the calculation is always on the static (quiet) side, with no option to switch between flowing and static sides.
- Go to Wells in the navigation panel and select Rod Pump Well.
- Go to Bottomhole Pressure in the navigation panel.
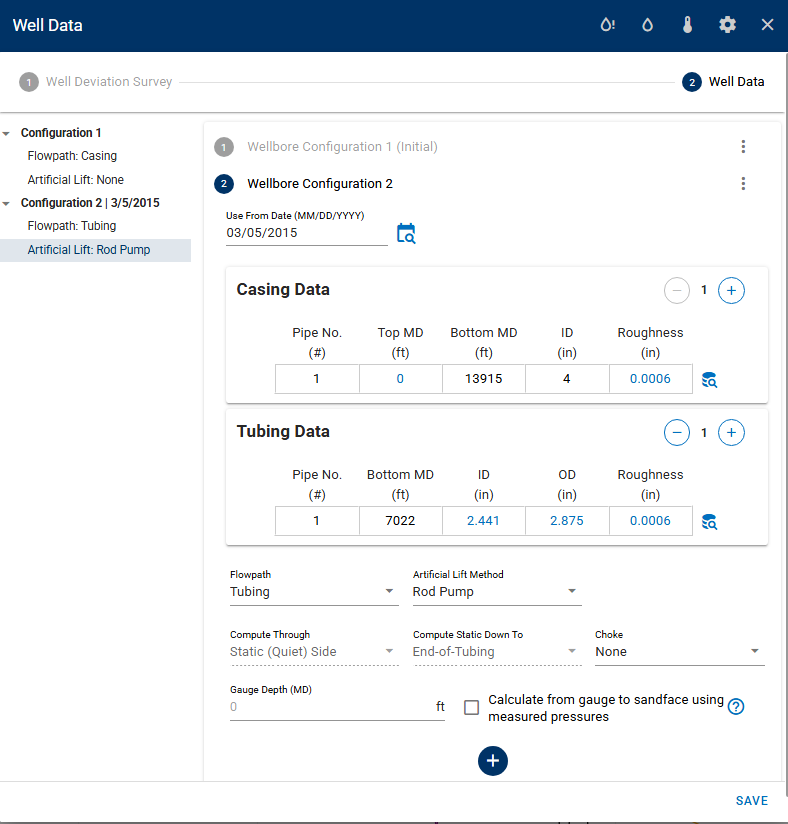
- Open the Well Data input card by clicking the edit icon.
- Go to the Well Data tab on the top-right to see all your wellbore configurations.
- Add a second configuration by clicking the "+" button on the bottom of the panel.
- Input Date and Tubing Data as shown in figure below.
- Select the Flowpath as Tubing and Artificial Lift Method as Rod Pump.
- Click SAVE.
- Proceed to CALCULATE BOTTOMHOLE PRESSURE.
- All steps are shown in the .gif above.
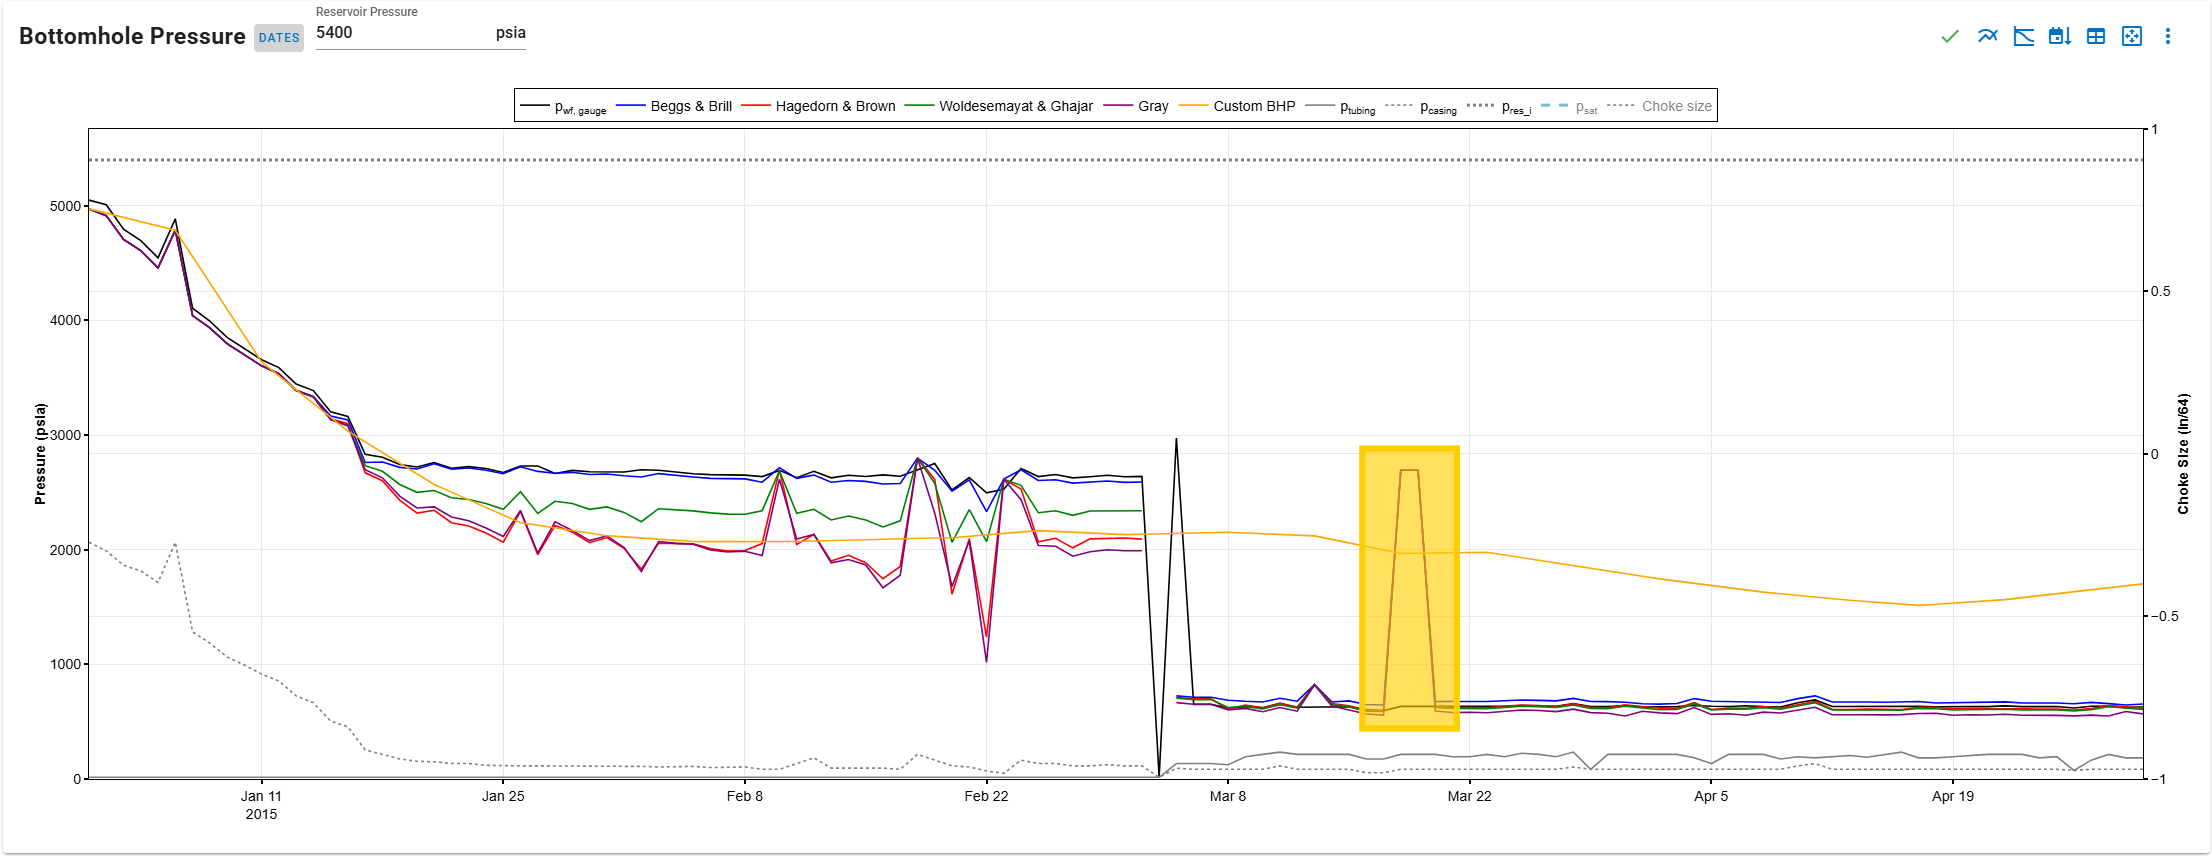
Do you notice the anomalous jump in the BHP calculation before March 22, 2015 on the figure below? This could be due to bad gas rates, missing liquid levels or other reasons. Is there a way to delete this spike?
3.2. Custom or Smoothing Pwf
One way to fix anomalous BHP calculation results is by applying custom editing or smoothing techniques. This helps remove sudden spikes or inconsistencies, ensuring a more realistic and stable BHP trend.
- Go to the Bottomhole Pressure module in the navigation panel.
- On the Bottomhole pressure to be used in calculations dropdown, select Custom pwf.
- Edit Custom BHP page will pop up, and choose one of the correlations as basis for smooth BHP.
- In this case, you can choose Hagedorn & Brown with Sampling frequency of 5.
- Click AUTOFIT.
- Click SAVE.
- All steps are shown in the .gif above.
3.3. Edit Production Data
We can add a gas rate data point for the affected date since the well is producing, but the gas rate is missing. This causes the BHP calculation to assume a fully liquid annulus (no gas above the liquid level), likely leading to the BHP discrepancy.
- Go to the Production Data module in the navigation panel.
- Click the SMOOTH button on the top-right of the plot.
- Select Gas rate as the Production data to smooth.
- Click the Add Points button (circle button with + sign on the top-right of the plot) and add points on the plot for days 76 and 79.
- Turn on the check box on Gas rate on left panel to use the new custom gas rate data.
- Click SAVE.
- Go to the Bottomhole Pressure module in the navigation panel.
- Proceed to CALCULATE BOTTOMHOLE PRESSURE.
- All steps are shown in the .gif above.
3.4. Calculation Settings (Additional Information)
If liquid level data is missing and you want to exclude that period from BHP calculation, you can turn off the Rod Pump / Plunger Lift toggle in the artificial-lift settings. This prevents BHP from being calculated when the liquid level is 0, avoiding inaccurate results.
- Go to the Production Data module in the navigation panel.
- Click the EDIT button on the top-right of the plot.
- Scroll down to days 77 and 78 and delete the liquid level data.
- Click SAVE.
- Go to the Bottomhole Pressure module in the navigation panel.
- Open the Well Data input card.
- Click Calculation Options button (gear icon in the top-right of the panel).
- Turn off the toggle on the Rod Pump / Plunger Lift: Compute when Liquid Level is 0.
- Click SAVE.
- Proceed to CALCULATE BOTTOMHOLE PRESSURE.
- All steps are shown in the .gif above.
4. ESP Well
The next well is a black oil well equipped with an ESP.
In whitson+ there are two ways to calculate BHP for ESP-lifted wells:
- From pump intake sensor (gauge) using measured pump intake pressure
- From wellhead using an ESP performance map (ESP model and manufacturer data)
4.1. ESP configuration using pump intake pressure
Typically, ESPs have a pressure gauge at the inlet (pump intake pressure) which can be used to calculate BHP directly rather than computing from the wellhead. We will calculate BHP using the ESP inlet pressure, which is recorded as the gauge pressure (pwf) in the production data table.
- Go to Wells in the navigation panel and select ESP Well.
- Go to the Bottomhole Pressure module in the navigation panel.
- Open the Well Data input card by clicking the edit icon.
- Go to the Well Data tab on the top-right to see all your wellbore configurations.
- Select the Artificial Lift Method as ESP.
- Input 8332 ft as the Gauge Depth (MD). The entered gauge pressures are assumed to be recorded at this depth (pump intake).
- Toggle “Calculate from gauge to sandface using measured pressures” on. This ensures that the BHP is calculated from the pump intake gauge pressure down to the top perforation, instead of from wellhead pressures, which become irrelevant in this calculation.
- Click SAVE.
- Click CALCULATE BOTTOMHOLE PRESSURES.
- All steps are shown in the .gif above.
Try changing the Gauge Depth (MD). Do you see a change in the BHP calculation results?
Recommended practice for ESP BHP calculations
When reliable pump intake pressure is available, the preferred calculation path is Pump intake pressure → bottomhole pressure, because it uses the shortest pressure path and minimizes assumptions. In this mode, wellhead pressures and ESP map details are not needed for BHP and should not be used to tune BHP correlations for ESP wells (see the main BHP manual section on ESP tuning).
4.2. ESP configuration using pump performance map
For wells without a reliable pump intake gauge, you can instead compute BHP from the wellhead using an ESP model and performance map. In this mode, whitson+ calculates from tubing head pressure down to the pump discharge, uses the pump performance map to find the pump intake pressure, then continues to the top perforation.
- In the top Scenario dropdown, make sure you are on the scenario where you completed the gauge-based ESP setup (usually Main).
- Click Add new scenario.
-
Name the new scenario "ESP – Pump map" (or similar) and click SAVE.
-
Open the Well Data input card by clicking the edit icon.
- In the Well Data tab:
- Make sure the Flow path is set to Tubing.
- Set Artificial Lift Method to ESP (if not already selected).
- Make sure “Calculate from gauge to sandface using measured pressures” is turned OFF.
-
If the ESP configuration window does not open automatically when you select ESP, click the edit button next to ESP to open the ESP data dialog and enter the following values:
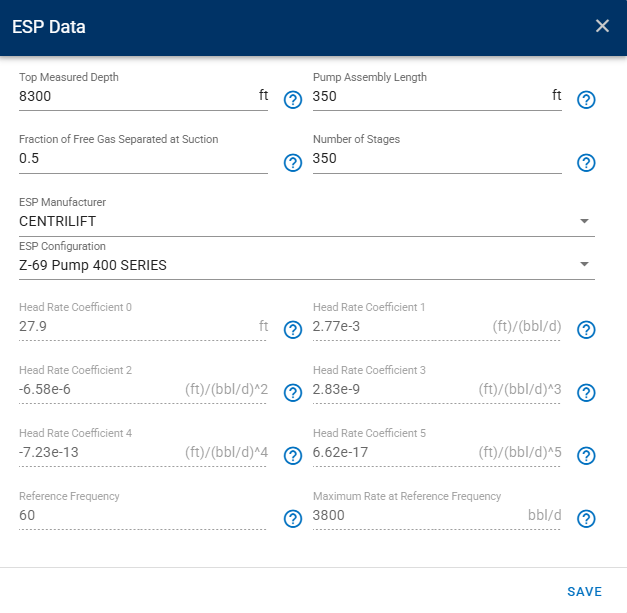
-
Click SAVE in the ESP dialog to store the ESP configuration.
- Click SAVE in the well data card.
- Click CALCULATE BOTTOMHOLE PRESSURES.
- All steps shown above.
Here the software will use the ESP pump performance map to calculate the pump intake pressure for the given rate and frequency, then continue the pressure calculation from the pump intake down to the top perforation to generate the full bottomhole pressure profile.
As a quick check:
- Compare BHP results in "ESP – Pump map" against the original gauge-based ESP scenario.
- Note where the two BHP estimates are similar and where they differ.
- Think about which setup would be more reliable for this well, given the data quality (measured pump intake vs modeled pump performance).
When to use which ESP mode
- Use gauge-based ESP mode when you have reliable pump intake gauge pressures; this gives the shortest and most robust pressure path.
- Use ESP map mode when pump intake pressure is unavailable or unreliable, or when you want to test different ESP designs (number of stages, pump models, operating frequency) and see how they impact BHP and well performance.
5. Jet Pump Well
In this next section you will set up and run a BHP calculation for a jet-pump lifted well, using both power-fluid data and the built-in jet pump performance maps. The goal is to:
- Use power fluid pressure and rate included in the Production Data for the first 30 days
- Let the software use the jet pump performance map for the later 30 days where power fluid rate is not provided
- Configure the Jet Pump
- Calculate and review the impact on BHP
5.1. Review production data and run PVT
Before changing any well settings, start by looking at the production data and initialize PVT to understand how this example is set up.
- Select Jet Pump Well.
- Go to the PVT module in the navigation panel.
- Open the Reservoir Fluid Composition Input Card
- Initialize the fluid in the GOR method.
- Click SAVE.
- Check the predicted fluid composition by clicking the "eye icon".
- All steps are shown in the .gif above.
Then, move on to the production data tab
- Go to Production Data in the navigation panel.
- Locate the columns Power Fluid Rate and Power Fluid Surface Pressure.
- Scroll through the table and note that:
- For Days 1–30, both Power Fluid Rate and Power Fluid Surface Pressure have values.
- For Days 31–60, Power Fluid Surface Pressure still has values, but Power Fluid Rate is left blank (or zero).
This split is intentional: on days where both pressure and power fluid rate are provided, whitson+ uses the nozzle equation together with the jet pump performance map (Method 1), while on days where only pressure is available it automatically switches to a map-based calculation that estimates power fluid rate and suction pressure from the performance map (Method 2). You will see this behavior when you run the BHP calculation later.
5.2. Configure the jet pump in BHP
- Go to Bottomhole Pressure in the navigation panel.
- Open the Well Data input card by clicking the edit icon.
- In the Well Data tab:
- Set the Flow path to Annulus.
- Set Artificial Lift Method to Jet Pump.
-
If a Jet Pump configuration window does not open automatically when you select the artificial lift method, click the edit button next to Jet Pump to open the jet pump data dialog and enter the following values:
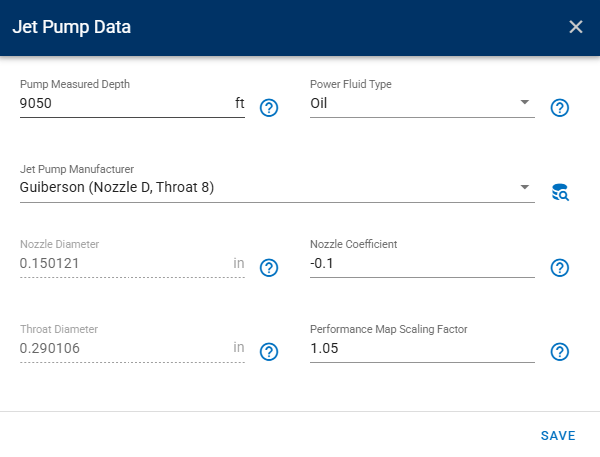
-
Click SAVE in the Jet Pump dialog.
- Back in the Well Data card, make sure “Calculate from gauge to sandface using measured pressures” is OFF.
- Then, to allow whitson+ to use power fluid rate where available and fall back to the jet pump map where needed, you must enable the jet pump map fallback option. In the Calculation Options section symbolized by the cogwheel, make sure the option “Jet Pump: If calculation with power fluid fails, ignore the input power fluid and calculate using map” is checked.
- Click SAVE.
With this box checked, whitson+ will use pressure + rate when the power-fluid calculation works, and automatically switch to the map-based method when the power-fluid calculation fails or when no power-fluid rate is present in the production data. If you uncheck this option, the software will no longer fall back to the map when the power-fluid calculation fails, so you effectively lose the intended “half with rate, half with map” behavior in this example.
In this setup, whitson+ will:
- For Days 1–30 (with power fluid rate): use power fluid surface pressure and power fluid rate, apply the nozzle equation and the jet pump performance map to compute suction pressure at the pump, then continue the pressure calculation along the selected flow path (annulus) from the jet pump down to the top perforation to generate the bottomhole pressure profile.
- For Days 31–60 (no power fluid rate): use power fluid surface pressure only, rely on the jet pump performance map to estimate power fluid rate and suction pressure, and then complete the pressure calculation to the top perforation.
Gauge vs jet pump behavior
If you turn on “calculate from gauge” and the gauge is above the pump, BHP will be computed from gauge to top perf and will ignore the jet pump. If the pump is below the gauge depth, the jet pump is still included. For this exercise, keep the gauge-based flag off so the jet pump model is always used.
5.3. Matching BHP to gauge data and real-well practice
- Compare the calculated BHP or suction pressure with the measured gauge values.
- If the calculated suction pressure is systematically too low, try decreasing the nozzle coefficient slightly.
- If the calculated suction pressure is too high, try increasing the nozzle coefficient.
This training well is designed to show how whitson+ behaves both with and without power fluid rate in the production data. In real wells, if you have reliable metered power fluid rates, it is generally better to always enter those values and use the pressure + rate calculation. The map-only mode is mainly a backup when power-fluid rates are missing or not trustworthy, or when you want to test sensitivities to jet pump design and operating conditions.
6. Plunger Lift Well
In this section, you will set up and run BHP calculations for a plunger-lifted gas well using both plunger-lift options:
- Option 1 – Static (quiet) Side using measured liquid levels in the annulus
- Option 2 – Flowing Side using plunger cycle times and gas-lift rate
6.1. Review production data
- Select Plunger Lift Well.
- Go to Production Data in the navigation panel.
- Look at the Liquid Level MD and Gas Lift Rate columns
You should see two distinct periods in the same dataset:
-
Days 1–30:
- Liquid Level MD has values and Gas Lift Rate is null.
- This represents a plunger-lift well with no bottom packer and no gas injection, where BHP is calculated from the static liquid level in the annulus.
-
Days 31–60:
- Liquid Level MD is null and Gas Lift Rate has zero and non-zero values that vary slightly day to day.
- This represents a plunger system with gas assistance GAPL and PAGL, where BHP is calculated from the flowing side using plunger cycle times.
Next, you will configure the well twice by assigning different wellbore configuration dates:
- Static (quiet) Side for Days 1–30
- Flowing Side starting on 2026-01-15 for Days 31–60
6.2. Static Side using liquid level
- Go to Bottomhole Pressure.
- Open the Well Data input card.
- Make sure you are editing Wellbore Configuration 1 that applies to the first production date.
-
In the Well Data tab, enter the following values:
-
For this period, you do not need to enter plunger cycle times. The calculation will use:
- The measured liquid level from the Liquid Level MD column
- The stock-tank rates and pressures from production data
-
Click SAVE on the Well Data card.
- All steps shown above
6.3. Flowing Side with plunger cycle and gas-lift
For the second half of the dataset, you have gas-lift rates and no liquid level, so you will add a new configuration date in the same scenario and switch the method to Flowing Side.
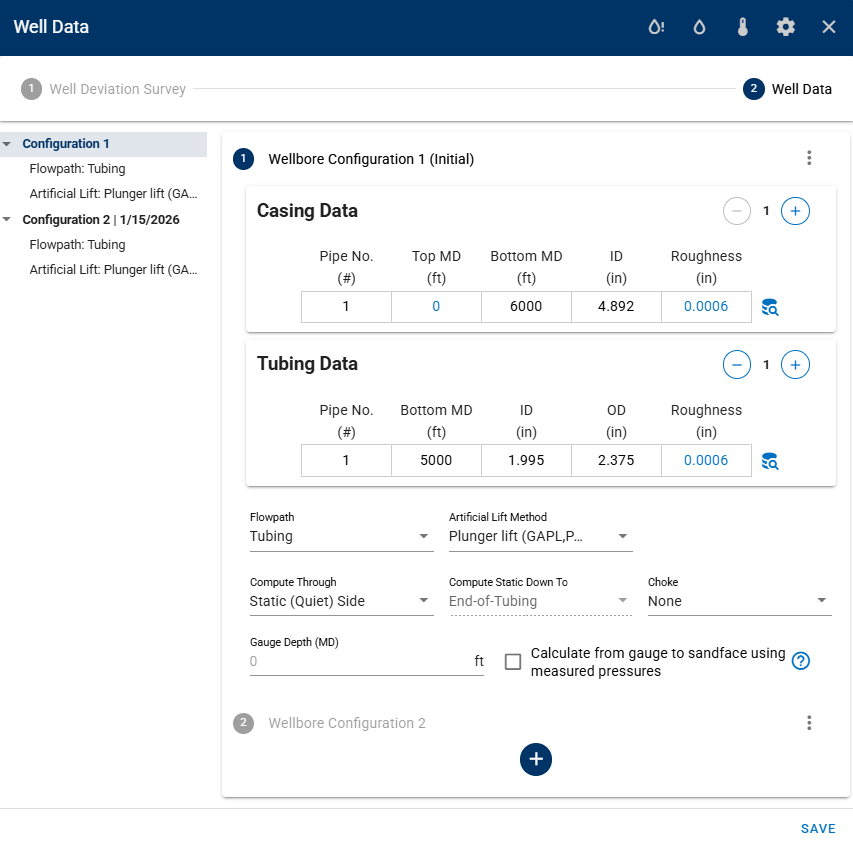
- Still in Bottomhole Pressure → Well Data, create a new wellbore configuration that starts on 2026-01-15.
- In the 2026-01-15 configuration selected, keep:
- Flow path = Tubing
- Artificial Lift Method = Plunger Lift (GAPL, PAGL)
- Change:
- Compute Through = Flowing Side
-
In the plunger-lift input fields, enter the following values:
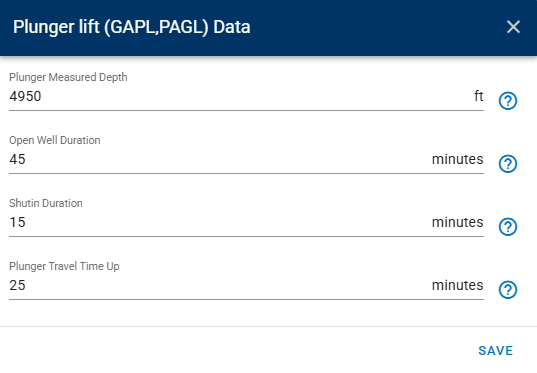
-
Click SAVE on the Well Data card.
- All steps shown above.
6.4. Run BHP and verify the configuration
Now that both configurations are saved (Static Side for early dates, Flowing Side starting 2026-01-15), you can run the calculation one time across the full date range.
- In Bottomhole Pressure, click CALCULATE BOTTOMHOLE PRESSURES.
- After the calculation finishes, click Show wellbore configuration dates.
- This overlays markers on the results so you can clearly see where the new configuration begins.
- Review results by date range:
- 2025-12-16 to 2026-01-14 (Days 1–30): BHP reflects Static (quiet) Side using the liquid level in the annulus.
- 2026-01-15 to 2026-02-13 (Days 31–60): BHP reflects Flowing Side using plunger cycle behavior and gas-lift rate.
- All steps shown above.
Can you clearly see where each calculation starts? You should be able to pick out the sections where the model switches between Plunger Lift only (no bottom packer), GAPL, and PAGL calculations.
7. Done?
When you are done with your BHP calculation certification, please:
- Send an e-mail to certification@whitson.com
- Make the subject: "whitson+ BHP certificate: [YOUR NAME HERE]".
- Include the link to your project.
- If you have any notes, comments, or observations related to the well, feel free to share them with us. Also, feedback on the user-friendliness of the software is always appreciated.
After that, we'll provide some feedback on your work and issue your whitson+ certificate if all looks good.
8. Want to learn more?
Schedule a BHP session with one of our engineers. Contact support@whitson.com.
Read more about the following here: