Simulated PVT Study
1. Generating a Simulated PVT Study
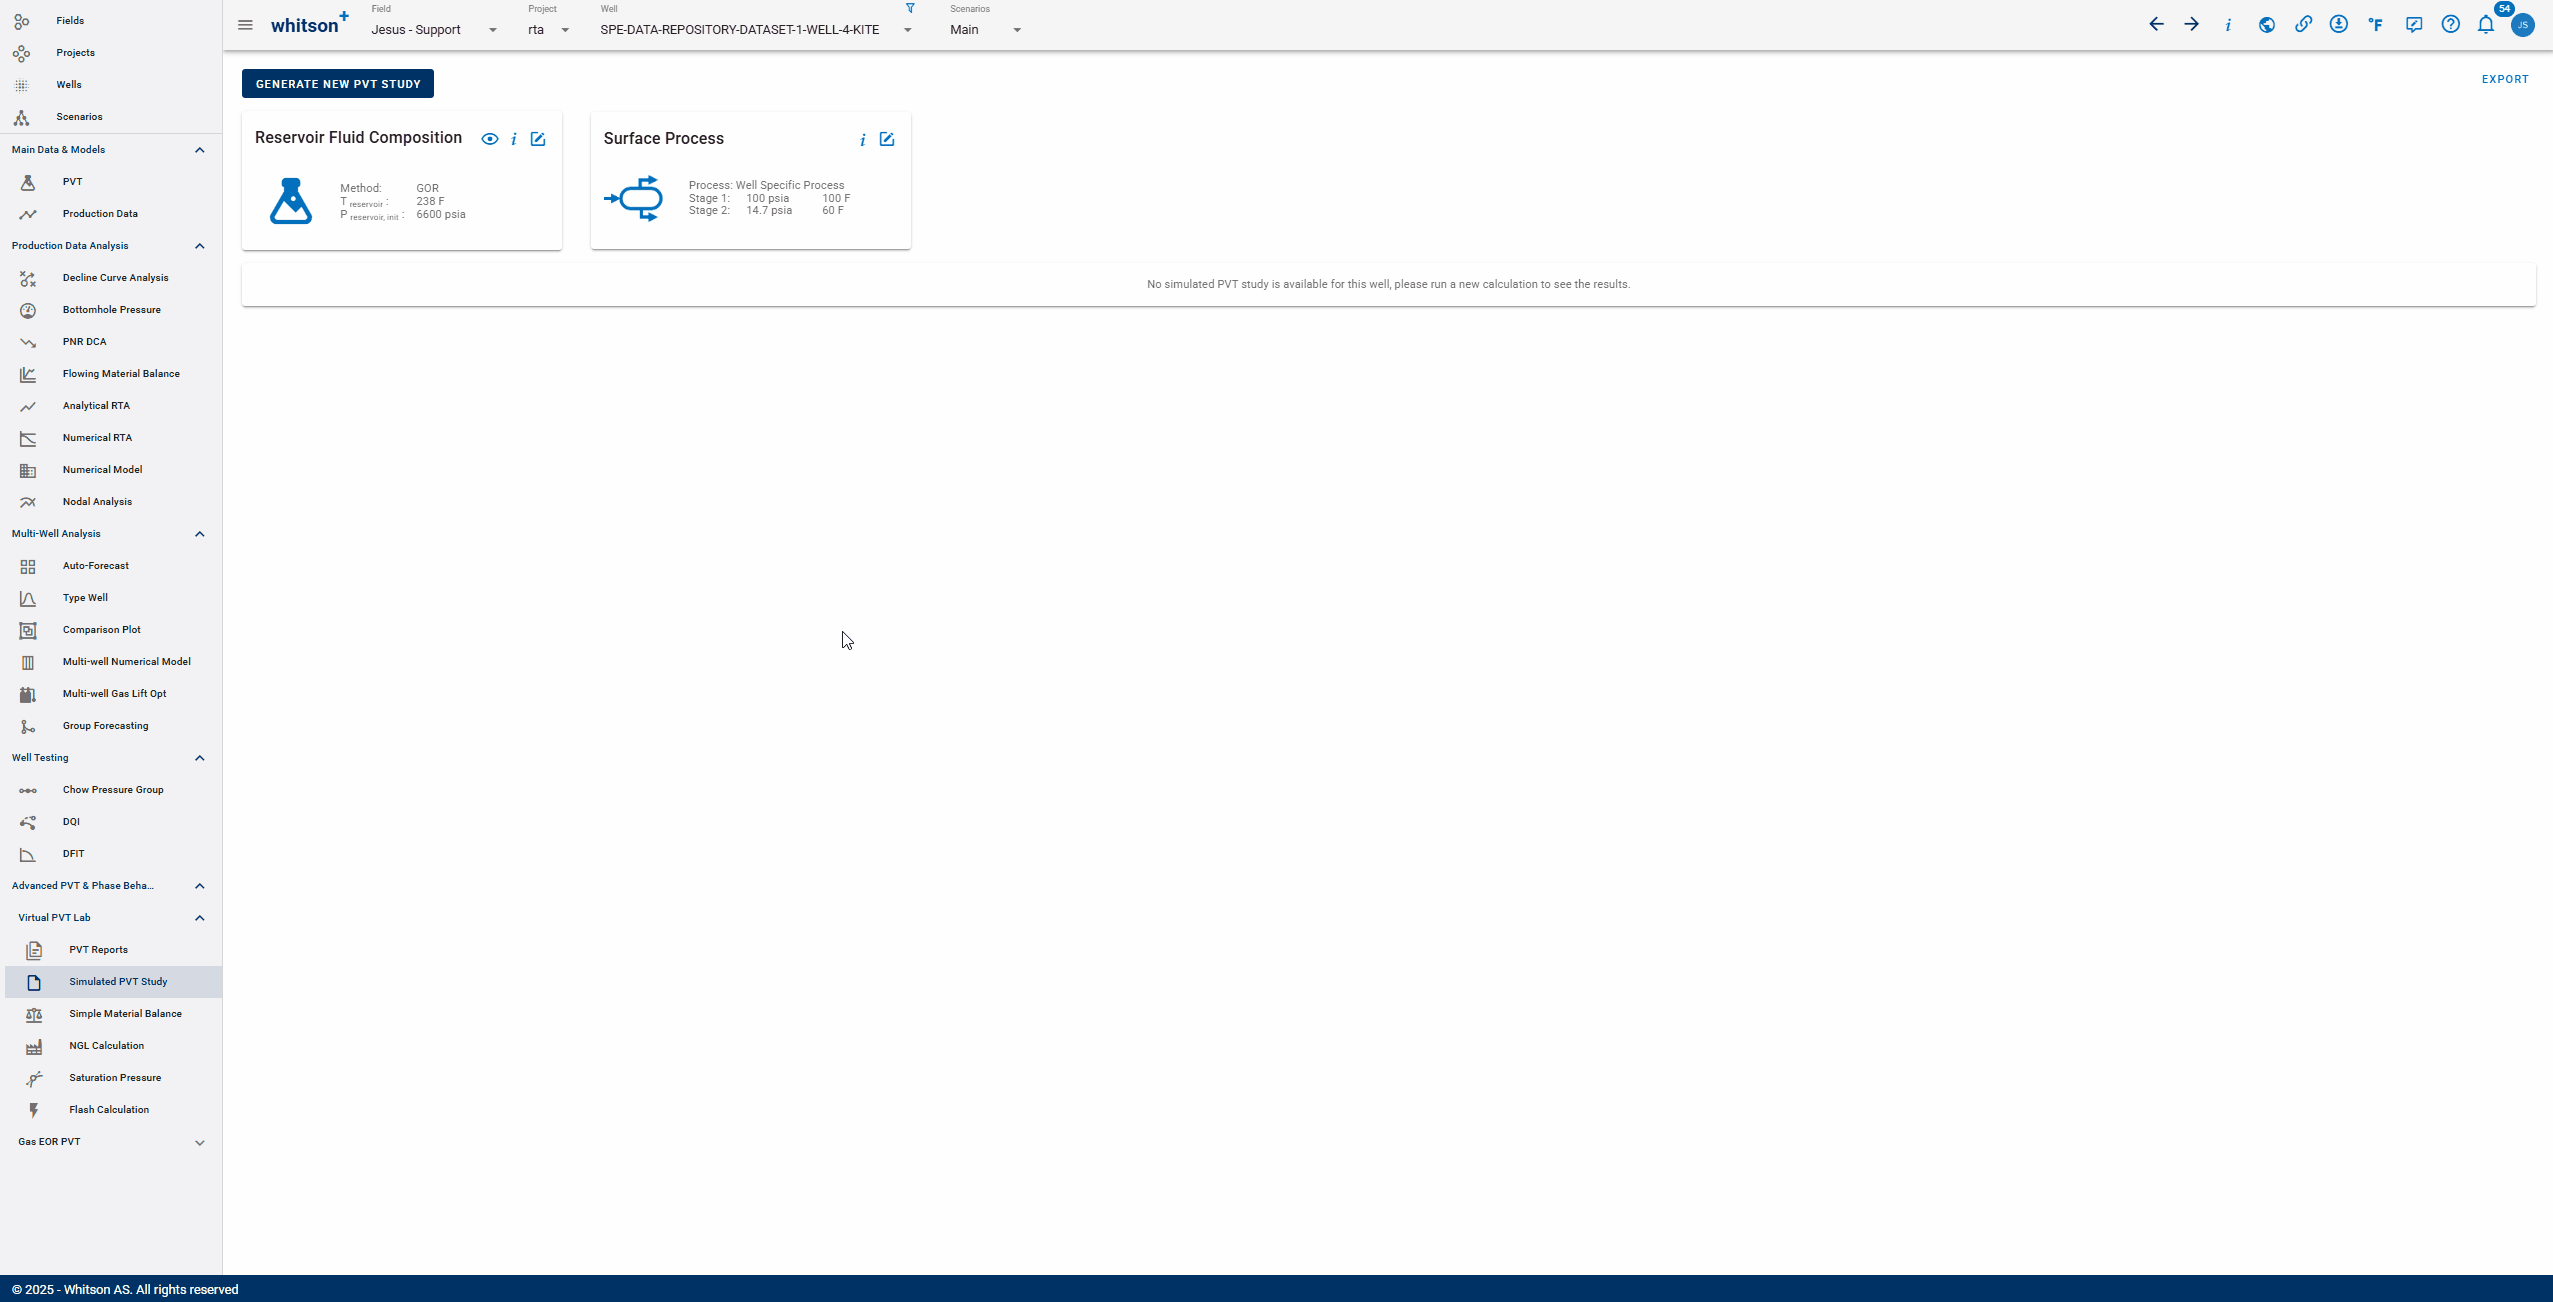
In this module, a simulated PVT study, equivalent to the PVT study / PVT report that is obtained from a PVT laboratory is generated with readily available data. In order to create a simulated PVT study, you must run the following:
-
Reservoir Fluid Composition:
- Choose an Initial reservoir fluid composition (generated with any of the available methods)
- Input an initial reservoir pressure
- Input a Reservoir temperature
-
Surface Process:
- Edit the surface process associated to the well (used to generate the black oil table)
The following experiments will be simulated depending on the saturation pressure type of the defined fluid:
| Experiment | Bubblepoint | Dewpoint |
|---|---|---|
| Single Stage Flash (SSF) | X | X |
| Constant Composition Expansion (CCE) | X | X |
| Differential Depletion Experiment (DLE) | X | |
| Constant Volume Depletion (CVD) | X | X |
| Multi-Stage Separator Test (MST) | X | X |
| Viscosity Experiment - DLE (VISC) | X |
Single Stage Flash Experiments
It is common for the PVT lab to use a higher temperature for the SSF mainly to ensure that the stock tank oil is thermally stable at room temperature. Single stage flash experiments at this higher temperature (140 F = 60 C) are provided with the simulated PVT study, together with the "standard" SSF experiment where the fluid is directly flashed to 60 F.
Viscosity Experiments
The standard viscosity experiment performed by PVT labs is following a differential liberation expansion (DLE) type of depletion. That is why the experiment is called "Viscosity Experiment - DLE". In the simulated PVT study, viscosities are also provided when the fluid is subject to other types of depletion, so the oil viscosity can be found in the CCE and CVD experiments.
2. Export
2.1. Excel
The Export to Excel feature, located in the top-right corner of the Simulated PVT Study section, provides a detailed PVT study/report in a format similar to that provided by commercial PVT laboratories. Inside the Excel file, you’ll find data for all the experiments, including:
- Released gas (at each stage) and residual oil compositions for the depletion experiments, e.g. CVD, DLE
- Released gas (at each stage) and stock tank oil compositions for separator tests, e.g. MSF and SSF
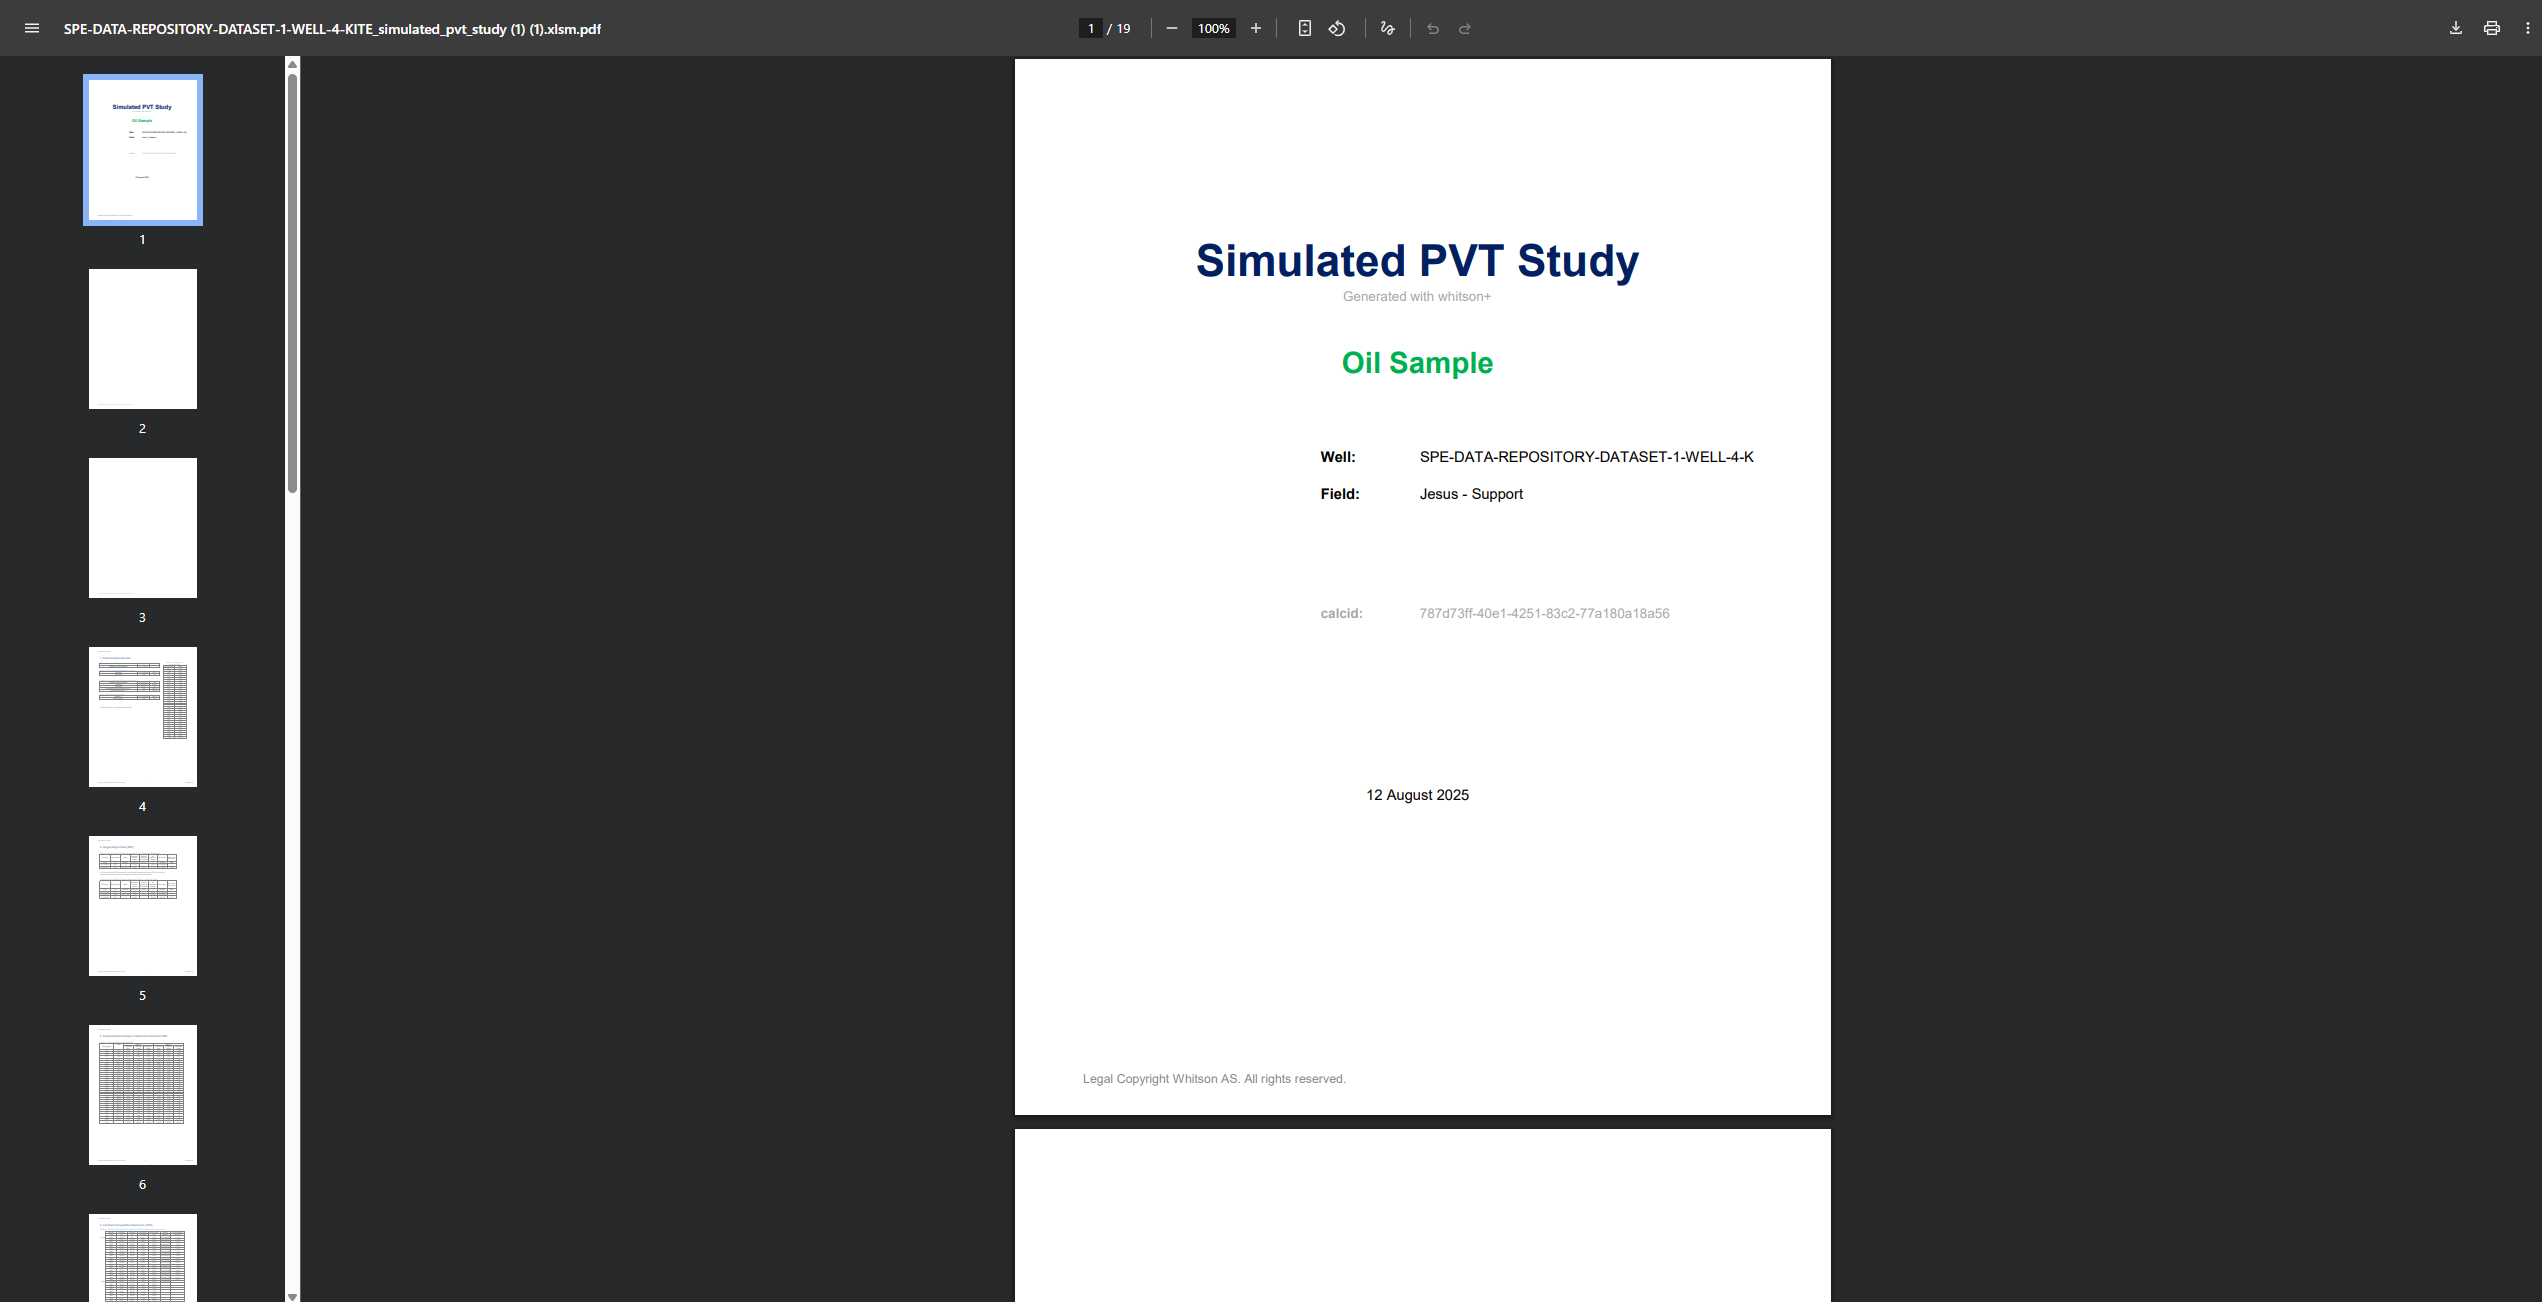
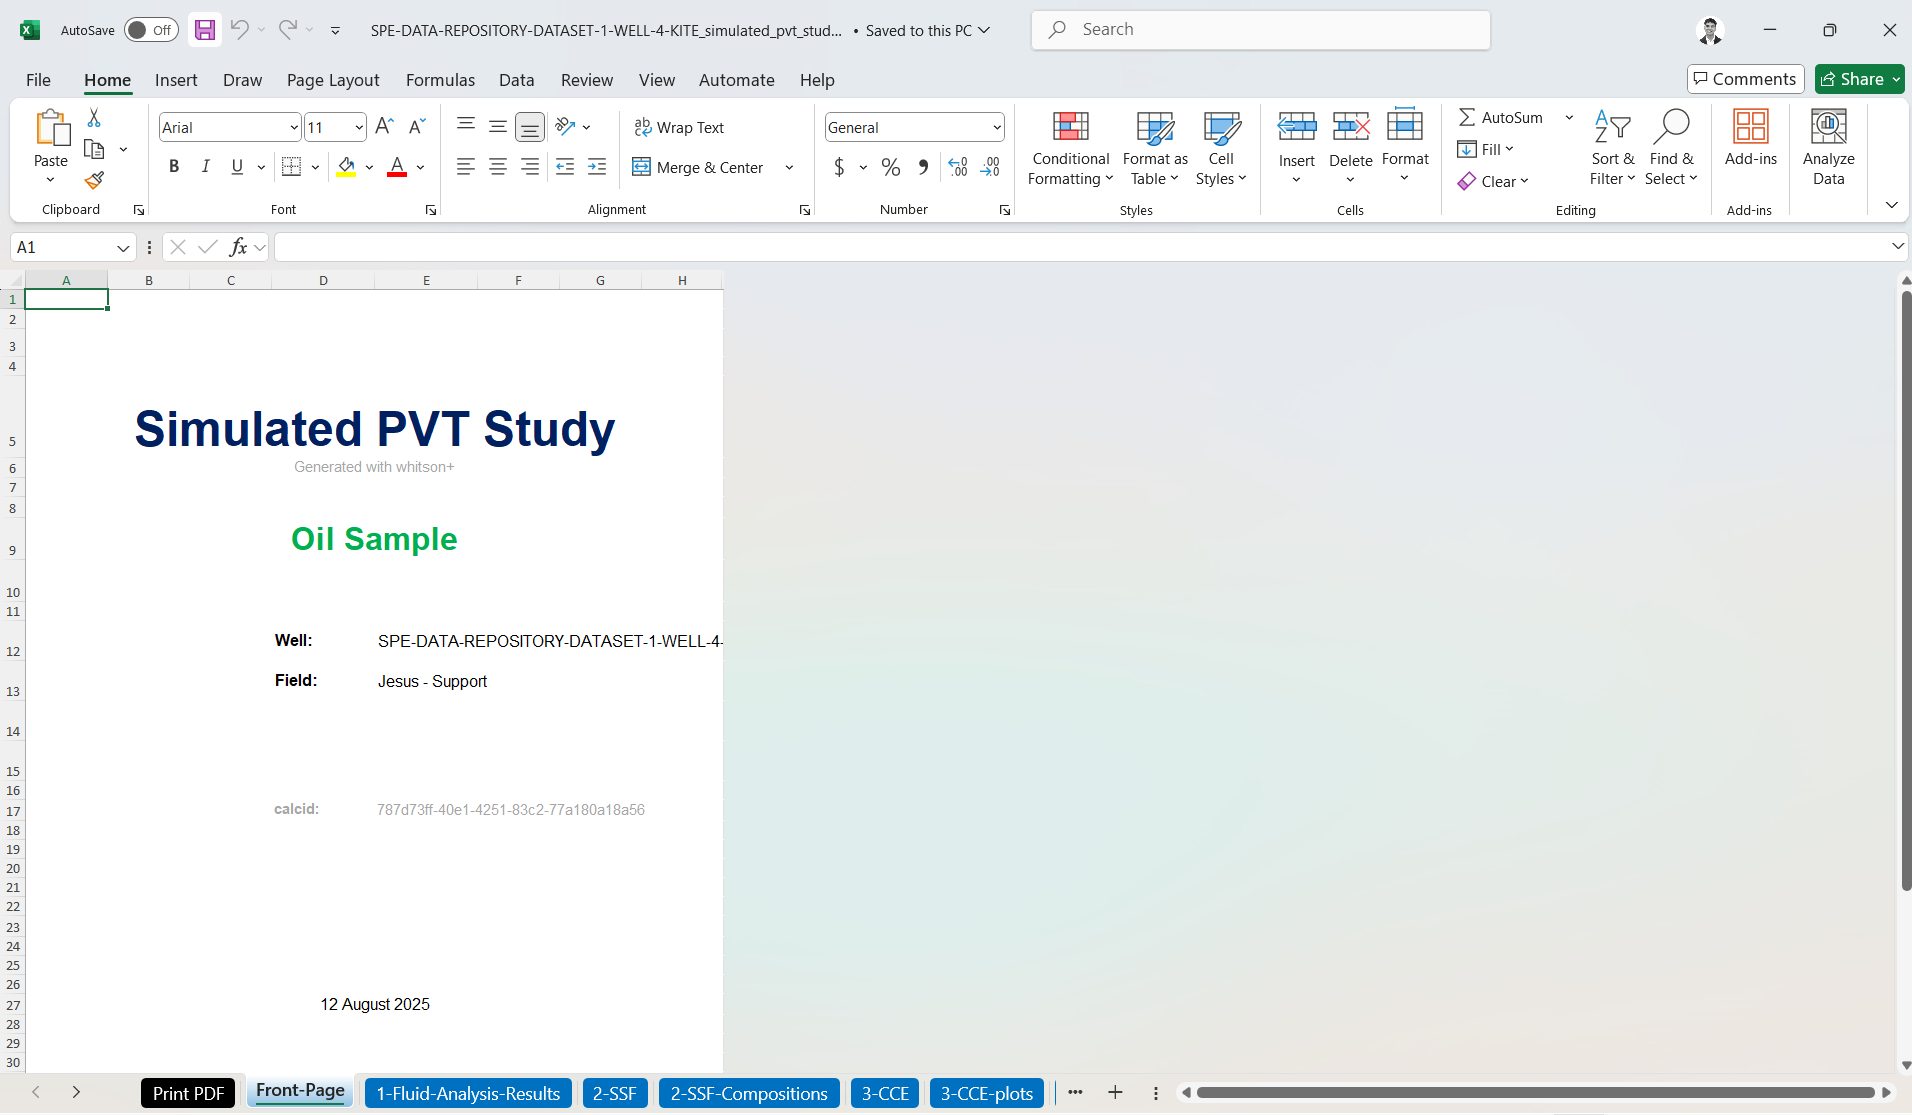
Here's an example of what that looks like - SPE-DATA-REPOSITORY-DATASET-1-WELL-4-KITE_simulated_pvt_study (1).xlsm
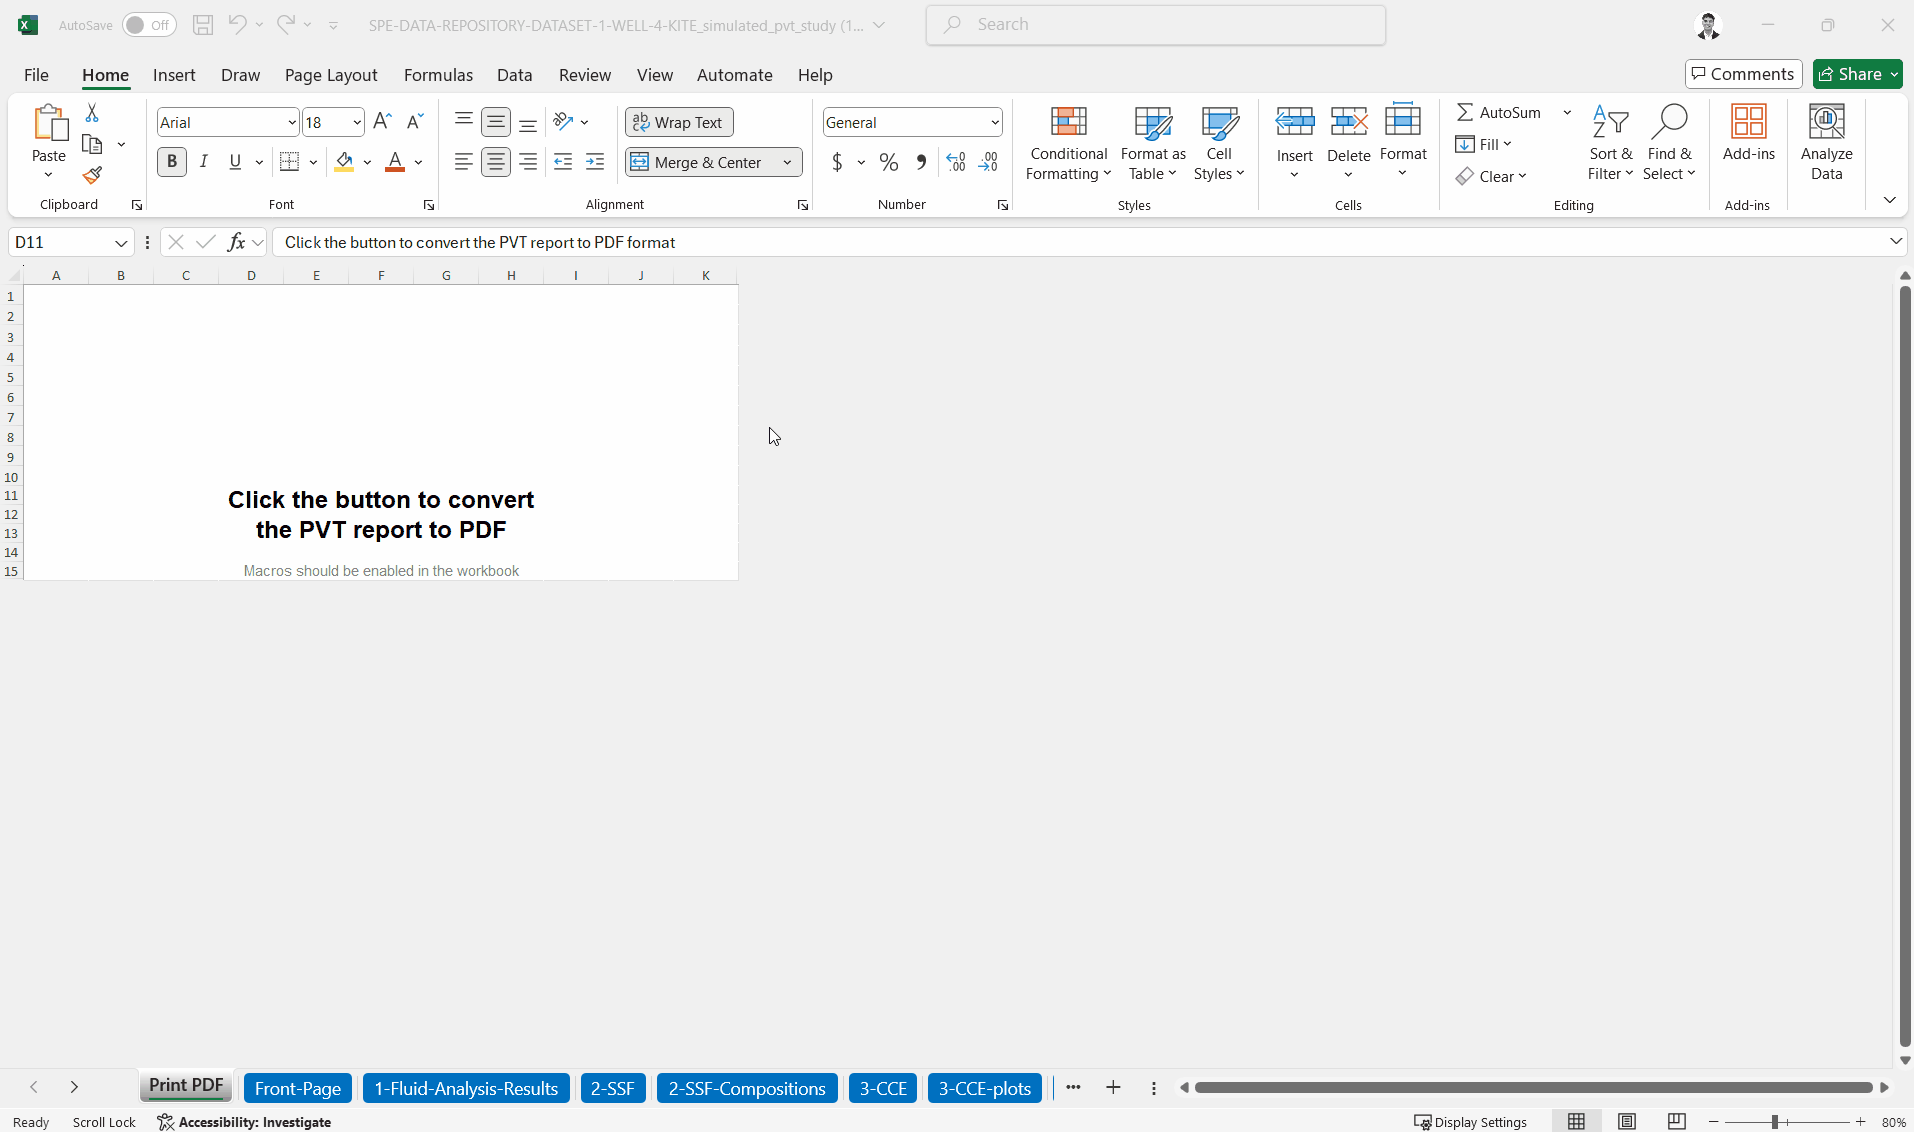
2.2. PDF
In the Excel file, go to the first tab called "Print PDF". Macros should be enabled in the workbook to do this. The report is then generated in PDF format and can be printed into A4 paper.
To enable macros, you can follow these steps:
-
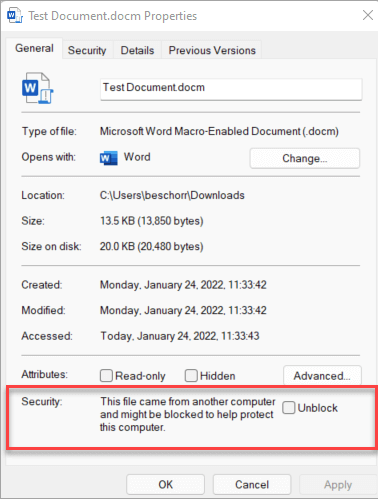
Open Windows File Explorer and go to the folder where you saved the file.
-
Right-click the file and choose Properties from the context menu.
-
At the bottom of the General tab, select the Unblock checkbox and select OK.
Then, open the excel file previously created an follow the steps highlighted in the gif below:
Here's an example of what that looks like - SPE-DATA-REPOSITORY-DATASET-1-WELL-4-KITE_simulated_pvt_study.pdf